Welcome to the next lesson in our exploration of the Java Virtual Machine. In our previous session, we created a high-level architectural map of the JVM, identifying its three core subsystems: the Class Loader, Runtime Data Areas, and the Execution Engine. We briefly noted that the Execution Engine is the component responsible for actually running your code, using an interpreter and a Just-In-Time (JIT) compiler.
Today, we will dive into the heart of Java's performance model by dissecting the work of the Execution Engine. Our objective is to differentiate between bytecode interpretation and JIT compilation, and to understand the sophisticated strategy the HotSpot JVM uses to identify and optimize the most critical parts of your code. This is a fundamental concept that explains how Java achieves high performance, often rivaling that of statically compiled languages like C++.
The Two Faces of Execution: Interpretation and Compilation
When the JVM's Execution Engine receives bytecode, it has two primary ways to execute it. Initially, all code starts its life in the hands of the Interpreter.
The Interpreter works by reading the bytecode stream one instruction at a time, translating it into the corresponding native machine instruction for the host CPU, and executing it immediately. This process is repeated for every instruction, every time the method is called.
Pros and Cons of Interpretation:
- Pro: It allows the application to start running almost instantly. There's no initial delay for a lengthy compilation process.
- Con: It's inefficient for code that runs frequently. If a method is called a million times, the interpreter will perform the same translation work a million times, which is a significant performance bottleneck.
To overcome this inefficiency, the JVM employs a Just-In-Time (JIT) Compiler. The JIT compiler operates at runtime, alongside your application. It identifies code that is executed frequently—so-called "hot spots"—and compiles that entire block of bytecode directly into highly optimized native machine code. This compiled native code is then stored in a memory area called the CodeCache. The next time that hot method is called, the JVM can skip the interpreter entirely and execute the fast, native version directly.
The following short video provides a concise summary of this fundamental trade-off.
How the Java Virtual Machine Works (and Why You Should Care)
This video from The Coding Gopher gives a quick and clear distinction between the roles of the interpreter and the JIT compiler.
Please watch from the section on interpretation, and continue through to the end of the JIT compiler explanation. This will solidify the core difference between the two execution modes.
This dual-mode execution strategy is why the most common JVM is named HotSpot: its primary feature is its ability to find these "hot spots" at runtime and give them special treatment.
How HotSpot Finds Hot Code
The key challenge for the JVM is to predict which code will be executed frequently enough to be worth the cost of compilation. Compiling code consumes CPU cycles and memory, so compiling everything would negate the fast startup advantage of interpretation and waste resources on code that runs only once.
HotSpot solves this with a technique called dynamic profiling. It doesn't guess; it observes. As the interpreter executes your code, it gathers statistics. Specifically, it uses two counters for each method:
- Method Invocation Counter: Increments every time the method is called.
- Back-Edge Counter: Increments every time a loop branch is taken (i.e., on each iteration of a loop).
The JVM combines these counts. When the total count for a method crosses a predefined threshold, the method is deemed "hot" and is scheduled for compilation.
How the JIT compiler boosts Java performance in OpenJDK
This article from Red Hat Developer clearly explains the rationale behind the HotSpot JVM's execution model.
Please read the section titled HotSpot's JIT execution model. This will clarify the four observations that led to this hybrid design and how the JVM transitions from interpreted to compiled code.
This profiling-based approach is a powerful heuristic. The assumption is that if a method has been executed many times in the past, it's likely to be executed many times in the future.
The Levels of Optimization: Tiered Compilation
Modern HotSpot JVMs refine this process even further with a strategy called tiered compilation. Instead of a simple switch from "interpreted" to "compiled," methods can be promoted through several levels, or tiers, of optimization. This provides a smoother trade-off between startup speed and long-term performance.
The system generally consists of:
- Tier 0: Interpreter: Executes all code initially, gathering basic profiling data (the invocation and back-edge counters).
- Tier 1-3: C1 Compiler (Client Compiler): When a method becomes "warm" (hits a first, lower threshold), it's compiled by the C1 compiler. C1 is a quick compiler. It performs simple optimizations and compiles the code rapidly. The goal is to get a performance improvement quickly without a long compilation pause. This C1-compiled code also includes instrumentation to gather more detailed profiling data (e.g., which branches of an
ifstatement are taken). - Tier 4: C2 Compiler (Server Compiler): If a method running in a C1-compiled form becomes truly "hot" (hits a second, higher threshold), it is handed over to the C2 compiler. C2 is a highly optimizing compiler. It uses the detailed profiling information from the C1 phase to perform aggressive, time-consuming optimizations like method inlining, loop unrolling, and escape analysis. The resulting code is extremely fast but takes longer to produce.
This tiered approach allows the JVM to provide a fast startup (thanks to the interpreter), a quick initial performance boost for warm code (thanks to C1), and maximum throughput for the application's most critical hot spots (thanks to C2).
The following diagram illustrates this flow. When a method is called, the JVM checks if a compiled version exists. If not, it executes the code via the interpreter, which counts the calls. Once a threshold is met, it triggers compilation, and the resulting native code is stored in the CodeCache for future use.
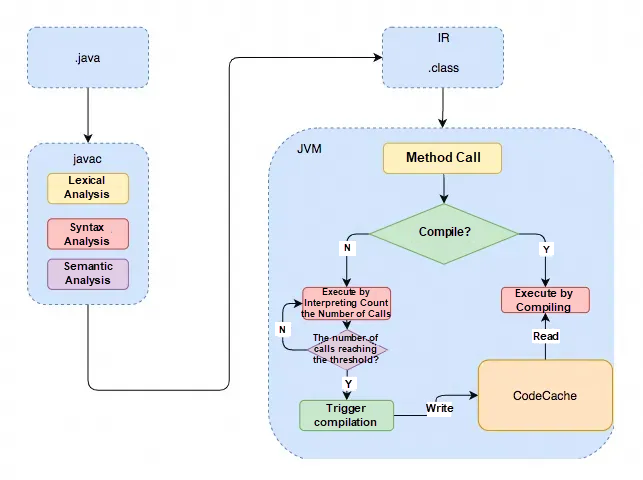
To get a deeper understanding of the trade-offs and the mechanics of tiered compilation, the following article provides an excellent, detailed explanation.
How Tiered Compilation works in OpenJDK - Microsoft for Java Developers
This article from the Microsoft Java Engineering Team offers a superb deep dive into the tiered compilation system, including the rationale and the specific implementation in HotSpot.
First, read the hypothetical example to build an intuition for the trade-offs between compilation cost and execution speed. Next, read the section on Hot Code Prediction to understand how thresholds are used as a practical solution to an otherwise unsolvable problem. Finally, read the core section titled Tiered Compilation in HotSpot. This details the five levels and explains how methods transition between the interpreter, C1, and C2 based on profiling and heuristics.
Speculation and Deoptimization: The Safety Net
The C2 compiler's real power comes from its ability to perform speculative optimizations. Based on the profiling data, it makes educated guesses about the program's behavior. For example:
- If
x.doSomething()is called 1,000,000 times, andxwas always an object of typeMyClass, C2 might speculatively inline theMyClass.doSomething()method directly at the call site, removing the overhead of a virtual method call. - If
if (obj != null)is always true, C2 might eliminate the null check entirely.
This is highly effective but potentially dangerous. What if, on the 1,000,001st call, x is suddenly an instance of MySubClass? The inlined code would be wrong.
To handle this, the JIT compiler inserts lightweight checks (or "guards") into the optimized code. If a speculative assumption is ever violated, the guard triggers a deoptimization. The JVM safely stops execution of the optimized native code, transfers the program state back to the interpreter, and resumes execution from the exact same point. The faulty compiled code is discarded, and the JVM may recompile the method later with more conservative assumptions.
Deoptimization is the critical safety net that allows the JIT compiler to be incredibly aggressive with optimizations while guaranteeing the correctness of the program.
How the JIT compiler boosts Java performance in OpenJDK
This final reading explains the powerful concepts of speculation and deoptimization, which are key to the C2 compiler's effectiveness.
Please read the entire section titled Deoptimization and speculation. Pay close attention to the two examples provided—null checks and class hierarchy analysis—as they are classic cases of speculative optimization.
Conclusion
In this lesson, we've moved beyond the static view of the JVM's architecture to see it as a dynamic, adaptive system. You now understand how Java bridges the gap between ease of development and high performance.
Here are the key takeaways:
- The JVM's Execution Engine uses a hybrid strategy: an Interpreter for fast startup and a JIT Compiler for high runtime performance.
- The Interpreter executes bytecode line-by-line and is slower but starts immediately.
- The JIT Compiler compiles frequently executed hot spots into native machine code, which runs much faster.
- The HotSpot JVM identifies hot code by profiling method calls and loop iterations using counters.
- Tiered Compilation provides a smooth performance curve by using a fast C1 compiler for "warm" code and a heavily optimizing C2 compiler for the "hottest" code paths.
- Speculative Optimization allows the C2 compiler to make aggressive assumptions for better performance, while Deoptimization acts as a safety net to ensure correctness if those assumptions fail.
We have now explored the journey of code from its entry into the JVM to its execution. In our next lesson, we will step back to the very beginning of this process and investigate the Class Loader Subsystem in detail. We'll examine the three distinct phases of class loading—loading, linking, and initialization—to understand precisely how your .class files are verified and prepared for execution.