Welcome to your second lesson. In our first session, we established that biostatistics is the science of using data to answer critical questions in health and medicine. We also touched upon a key idea in inferential statistics: using information from a small group (a sample) to make an educated guess about a much larger group (a population).
Today, we will dive deep into this fundamental distinction. Your goal for this lesson is to be able to clearly distinguish between a population and a sample, using examples directly relevant to your work as a future pharmacist. Mastering this concept is essential because almost all clinical research, from drug trials to safety studies, relies on sampling.
The Core Idea: Whole vs. Part
In statistics, the terms "population" and "sample" have very precise meanings. The population isn't just about the number of people in a country; it's the entire, complete set of individuals or objects that we are interested in studying. A sample is a smaller, manageable subset selected from that population.
To get a clear, practical explanation of this, please watch the following video. It uses a medical research scenario that will feel familiar.
Sample vs Population - Clearly Explained
This video from Steven Bradburn's channel provides a very clear and concise explanation of the two concepts.
Watch from the beginning to understand the definitions using the "Disease X" example. Then, continue watching to understand why researchers use samples instead of populations, as explained in the segment on the practicality of sampling.
As the video explained, studying an entire population is often impractical or impossible. Imagine trying to test a new cholesterol medication on every single person in the world with high cholesterol. It can't be done. So, researchers select a sample, conduct their study on that group, and then use inferential statistics to generalize the findings back to the entire population of interest.
Let's ground this with a reading from the tl;dr Pharmacy article we looked at in the last lesson. It uses an example that's very common in pharmaceutical care.
How to Be Awesome at Biostatistics and Literature Evaluation - Part I
This article provides concise, pharmacy-focused definitions.
In the section "Biostatistics Terms and Concepts," find the definitions for Population and Sample. Notice how the example connects to a specific patient group: "All patients with a prior ASCVD event."
So, to summarize with a pharmacy example:
- Population: All type 2 diabetes patients in India.
- Sample: The 1,000 type 2 diabetes patients from various cities across India who are enrolled in a clinical trial for a new glycemic control drug.
Parameters vs. Statistics: The Language of Data
When we measure something, the terminology we use depends on whether we are describing a population or a sample. This is a critical distinction.
- A parameter is a value that describes a characteristic of the entire population.
- A statistic is a value that describes a characteristic of a sample.
A simple way to remember this is:
- Parameter -> Population
- Statistic -> Sample
Population parameters are often what we want to know, but they are typically unknown and have to be estimated. Sample statistics are what we can actually calculate from our data. We use the sample statistic as our best estimate of the population parameter.
For instance, the true average blood pressure reduction for all patients taking a new drug is a parameter. The average reduction we measure in our 500-patient trial is a statistic.
Watch this segment of the video from earlier, which introduces this idea.
Sample vs Population - Clearly Explained
This part of the "Sample vs Population" video clearly explains the difference between a parameter and a statistic.
Please watch the section from this timestamp. Pay close attention to the different symbols used for the population mean (\mu, the Greek letter mu) and the sample mean (\bar{x}, or "x-bar").
This use of different symbols is a standard convention in statistics and one you'll see constantly in research papers.
- Population Mean:
- Sample Mean:
- Population Standard Deviation: (sigma)
- Sample Standard Deviation:
The Crucial Role of a Representative Sample
The entire process of using a sample to understand a population hinges on one critical condition: the sample must be representative. A representative sample accurately reflects the characteristics of the population it came from. If your sample is not representative, your conclusions about the population will be biased and potentially very wrong.
For example, if a new skin lightening cream is tested exclusively on a sample of fair-skinned individuals, can we confidently say it will work the same way for individuals with darker skin tones? Probably not. The sample did not represent the full diversity of the target population.
This is a major issue in clinical research. Look at the following chart, which shows the disparity between the racial and ethnic makeup of the U.S. population and the participants in U.S.-based clinical trials.

As you can see, the sample of trial participants is not a perfect mirror of the population. For example, White individuals make up 72% of the population but 80% of trial participants, while Hispanic individuals make up 16% of the population but only 6% of trial participants. This lack of representation can have serious consequences, as drugs may have different efficacy or side-effect profiles in different demographic groups. As a pharmacist, being aware of the sample characteristics in a study is vital for applying its results to your diverse patient base.
Let's Practice
Now, let's apply these concepts. Below is a diagram illustrating the relationship between a population and a sample in a pharmacy context. Try to fill in each blank by choosing the best option from the list provided in the image. Think it through, then check your answers below.
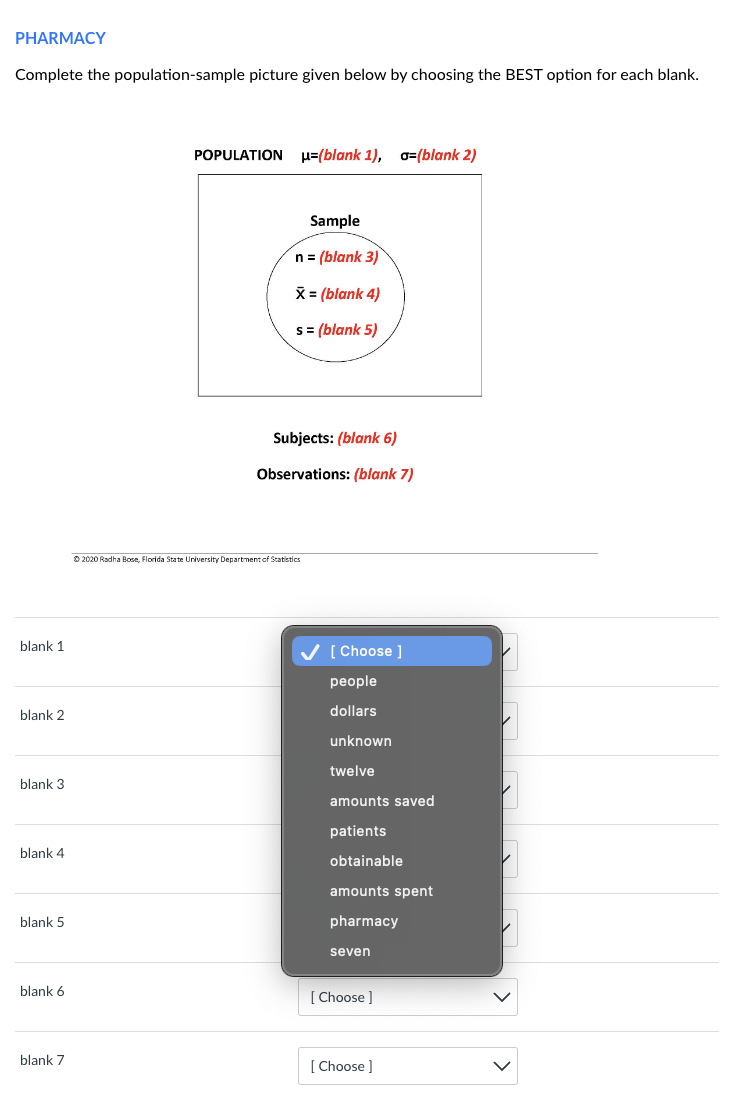
Solution and Explanation:
Here is a logical way to fill in the blanks, based on the principles we've discussed:
- Blank 1 (): unknown. is the population mean. It's a parameter we want to estimate, but its true value is almost always unknown.
- Blank 2 (): unknown. Similarly, is the population standard deviation, which is also a parameter whose true value is typically unknown.
- Blank 3 (n): twelve. 'n' represents the sample size, which is a specific, countable number of subjects.
- Blank 6 (Subjects): patients. In a medical or pharmacy context, the individuals being studied are the subjects, or patients.
- Blank 7 (Observations): amounts saved. Observations are the actual data points collected from each subject. Here, the study is measuring the "amounts saved."
- Blank 4 (): amounts saved. This is slightly ambiguous, but is the sample mean of the observations. The best description of what is being averaged is the "amounts saved."
- Blank 5 (s): dollars. 's' is the sample standard deviation. It measures the spread of the data, and its units would be the same as the observation's units. Since "amounts saved" are measured in currency, "dollars" is the most logical unit.
The key takeaway from this exercise is recognizing which terms relate to the whole population (and are usually unknown) versus those that relate to the specific, measurable sample.
Conclusion
In this lesson, we have carefully unpacked the crucial difference between a population and a sample, two of the most fundamental building blocks of biostatistics.
Key Takeaways:
- A population is the entire group you are interested in studying (e.g., all asthma patients in Mumbai).
- A sample is a smaller, selected subset of that population (e.g., 500 asthma patients from different Mumbai hospitals).
- We study samples because studying entire populations is usually impossible or impractical.
- A parameter is a numerical summary of a population (e.g., the true average age ). It is a fixed value, but usually unknown.
- A statistic is a numerical summary of a sample (e.g., the calculated average age ). We use it to estimate the population parameter.
- For a study's findings to be reliable, the sample must be representative of the population.
You now have a solid understanding of the "who" and "what" of statistical analysis. In our next lesson, we will build on this by looking at the different types of data we can collect from our sample. We will learn how to classify data as nominal, ordinal, interval, or ratio, which is the first step in deciding which statistical tools to use for analysis.