Hello! Welcome to your third lesson in the "Fundamentals of Digital Audio Processing" module.
In our last session, we explored the static characteristics of audio signals—their frequency content, dynamic range, and the psychoacoustic principles that govern our perception of them. We established that the Fourier transform is essential for understanding a sound's timbre, but it gives us a time-averaged "snapshot" of the frequency content. This is a limitation, as the most interesting aspects of audio, like melody and rhythm, are defined by how frequencies change over time.
Today, we will address this limitation head-on. Our goal is to apply windowing and the Short-Time Fourier Transform (STFT) for the spectral analysis of audio signals. We will develop the primary tool used in modern audio analysis: a method for creating a time-frequency representation that shows us what frequencies are present and when they occur. This will allow us to visualize sound in a way that aligns much more closely with our perception.
1. The Problem: Signals that Change
The Discrete Fourier Transform (DFT), which you've studied extensively, operates on a finite block of data. It implicitly assumes that this block represents one period of an infinitely repeating signal.
This assumption holds for stationary signals (like a pure sine wave), but it breaks down for real-world audio. When you grab a random chunk of a song or speech, the signal at the end of the chunk doesn't smoothly connect back to the beginning.

The solution is not to analyze the entire signal at once, but to break it into short, overlapping segments. The idea is that over a very short duration (e.g., 20-40 milliseconds), a complex audio signal can be considered "quasi-stationary"—its frequency content doesn't change too much.
By performing a DFT on each of these short segments, we can build a picture of how the spectrum evolves over time. This is the fundamental concept behind the Short-Time Fourier Transform.
2. Windowing: Taming the Discontinuities
Simply chopping the signal into segments, or frames, still creates artificial discontinuities at the edges. To mitigate the resulting spectral leakage, we multiply each frame by a window function. A window function is a finite-length sequence that is zero at its ends and typically smooth and bell-shaped in the middle.
Multiplying our signal frame by a window function tapers its values gracefully to zero at the boundaries. This ensures that when the DFT assumes the frame is periodic, the sharp discontinuities are gone.
To get a clear visual intuition of this entire process—framing, windowing, and the introduction of an overlap or hop size—let's watch a segment of the following video.
Short-Time Fourier Transform Explained Easily
The video 'Short-Time Fourier Transform Explained Easily' by Valerio Velardo provides an excellent high-level visualization of how we segment a signal into overlapping frames for analysis.
Please watch from 03:28 to 09:26. Focus on understanding the following concepts visually: Framing: The process of dividing the signal into small chunks. Windowing: How a window function (like the rectangular or Hann window) is applied to each frame. Frame Size vs. Window Size: The distinction between the FFT size and the duration of the applied window. Hop Size: The number of samples we shift forward to get the next frame, creating overlap.
This process of sliding a window along the signal, taking the DFT of each windowed frame, and stacking the results is the essence of the STFT.
3. The Short-Time Fourier Transform (STFT)
Now, let's formalize this process. Your background in signal processing will be very useful here, as the STFT is a direct and logical extension of the DFT.
Short-time Fourier Transform and the Spectogram
For a precise mathematical introduction, we'll watch a video from Prof. Barry Van Veen's channel, a trusted resource for DSP education. He will define the STFT and its output, the spectrogram.
Please watch from 01:36 to 04:22. Pay close attention to: The mathematical formulation of the discrete-time STFT. Note the two indices: one for time (n) and one for frequency (k). The definition of the spectrogram as the magnitude squared of the STFT.
As the video explains, the STFT, , is a two-dimensional function of time (frame index ) and frequency (bin index ). The equation is:
where:
- is the input signal.
- is the window function.
- is the time index, representing the position of the window.
- is the frequency index.
- is the size of the DFT.
This equation looks complex, but it describes exactly what we've been discussing: for each time step , it computes the DFT of the signal as seen through the shifted window .
The spectrogram, which we use for visualization, is simply the squared magnitude of the STFT:
Since we are now dealing with real-valued magnitudes, we can plot this as an image, with time on one axis, frequency on the other, and intensity/color representing the energy at that time-frequency point.
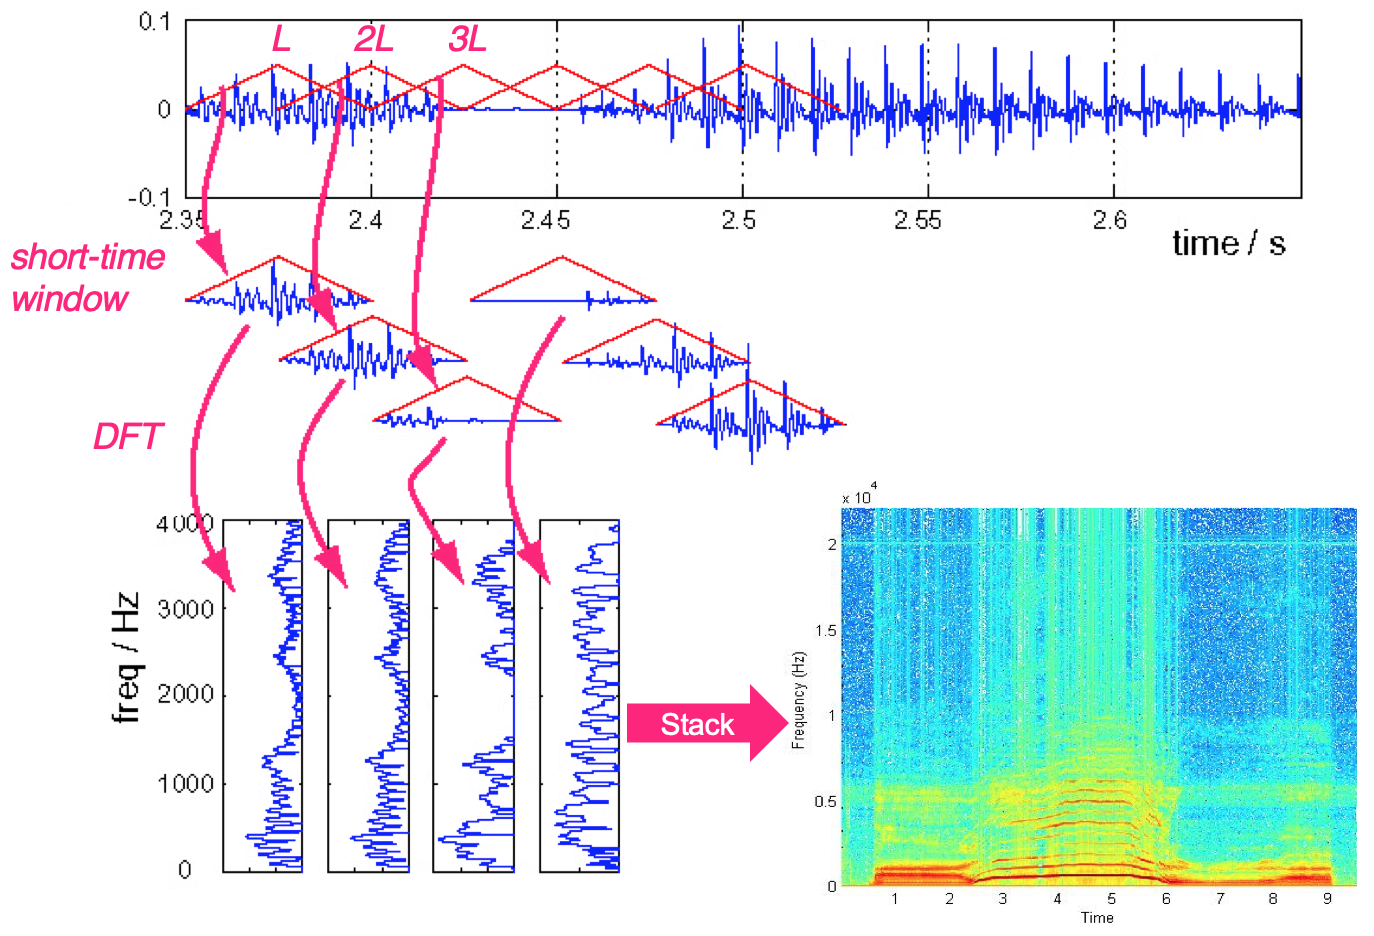
4. The Time-Frequency Resolution Trade-off
The choice of the window function's length is the most critical parameter in STFT analysis. It forces a fundamental trade-off, which has its roots in the uncertainty principle you may have encountered in Fourier analysis or quantum mechanics.
- A long window provides good frequency resolution. Because the window covers a longer time duration, the DFT can better distinguish between closely spaced frequency components. However, any rapid changes within that long window will be averaged out, leading to poor time resolution.
- A short window provides good time resolution. It can pinpoint transient events in the signal very accurately. However, the short observation time makes it difficult to resolve fine frequency details, leading to poor frequency resolution.
Let's see a practical demonstration of this trade-off.
Short-time Fourier Transform and the Spectogram
We'll return to Prof. Van Veen's video, as he provides a superb demonstration of this trade-off.
Watch the segment from 06:46 to 10:08. Observe how a long window (256 points) clearly separates the two constant-frequency sinusoids but blurs the moment of transition, while a short window (128 points) improves the temporal localization of the transition at the expense of smearing the frequencies together.
This trade-off is unavoidable. The choice of window length depends entirely on the application. For analyzing the pitch of musical notes, a longer window is often better to resolve harmonics. For detecting a drum hit or a speech plosive, a shorter window is preferred.
Test your understanding!
Imagine you are analyzing a piece of music containing both a sustained cello note and a rapid series of castanet clicks.
- What window length (short or long) would be better for analyzing the precise pitch and harmonic structure of the cello note?
- What window length would be better for determining the exact timing of each castanet click?
- What does this imply about using a single, fixed-window STFT for analyzing all aspects of a complex piece of music?
Show answer
- A long window would be better for the cello note. The sustained nature of the sound allows for a long observation time, which provides the high frequency resolution needed to separate the fundamental frequency and its harmonics.
- A short window would be better for the castanet clicks. These are transient events, and their precise timing is more important than their spectral content. A short window provides the necessary time resolution to locate each click accurately.
- This implies that a single, fixed-window STFT is a compromise. No single window length is optimal for analyzing all features in a complex signal. This limitation is what motivated the development of more advanced time-frequency analysis methods like the wavelet transform, which uses different window sizes for different frequencies.
5. Alternative Interpretations of the STFT
Given your background in electrical engineering, you will appreciate that the STFT can be interpreted in ways other than a sequence of DFTs. These alternative views are mathematically equivalent but offer different insights.
3. Short-Time Fourier Transforms
The course notes from Carnegie Mellon University provide a concise summary of two other important interpretations of the STFT.
Please read Section 3.3, 'Alternate interpretations of the STFT operation'. It's a short but dense section. Focus on understanding the conceptual difference between: Fourier Transform Interpretation: The view we've used so far (windowing then DFT). Lowpass Filter Interpretation: The signal is first modulated to bring the frequency of interest to DC (0 Hz), and then filtered by a lowpass filter whose impulse response is the window function. Bandpass Filter Interpretation: The signal is passed through a bank of parallel bandpass filters, where each filter is centered at a different analysis frequency. The STFT output is the collection of all filter outputs.
The filter bank interpretation is particularly powerful and common in signal processing. It recasts the STFT as a bank of equally spaced, identical bandpass filters. The bandwidth of each filter is determined by the Fourier transform of the window function. This neatly explains the time-frequency trade-off: a narrow-bandwidth filter (good frequency resolution) requires a long impulse response (poor time resolution), and vice versa.
Conclusion
Today, we've developed the essential tool for practical audio analysis. We moved from the static, time-averaged view of the DFT to the dynamic, time-varying representation of the STFT and the spectrogram.
Key Takeaways:
- Real-world audio signals are non-stationary, and analyzing them with a single DFT leads to spectral leakage.
- The STFT overcomes this by analyzing a sequence of short, overlapping, windowed frames of the signal.
- Window functions (e.g., Hann, Hamming) taper the frames to zero at the edges to reduce artificial discontinuities.
- The spectrogram, or the squared magnitude of the STFT, is a time-frequency representation that allows us to visualize how a signal's spectrum evolves.
- There is a fundamental time-frequency resolution trade-off controlled by the window length: long windows give good frequency resolution, while short windows give good time resolution.
- The STFT can also be interpreted as a filter bank, which provides a powerful link to your knowledge of LTI systems.
Preview of the Next Lesson:
Now that we have the tools to analyze the frequency content of audio over time, the next logical step is to modify it. In our next lesson, we will begin our study of digital filters, focusing on how to design and apply digital filters for audio equalization and tone control. We will use our understanding of the spectrogram to design filters that can boost, cut, or isolate specific frequency bands in an audio signal.