Hello! Welcome to your sixth lesson in our module on "System Analysis in the s-Domain."
In our last lesson, we built a powerful framework for understanding LTI systems from three different but interconnected viewpoints: the impulse response in the time domain, the transfer function in the s-domain, and the frequency response in the frequency domain. We concluded with the crucial identity that links the s-domain and frequency domain:
This states that the frequency response is simply the transfer function evaluated on the imaginary axis of the s-plane.
Today, we will move beyond asserting this fact and will formally derive this fundamental relationship. Our goal is to prove, from first principles, why substituting into a system's algebraic transfer function correctly yields the magnitude and phase change that a sinusoidal input experiences in the steady state. This derivation is a cornerstone of system analysis, bridging the abstract world of the s-plane with the tangible behavior of physical systems.
1. The s-Plane and the jω-Axis: A Conceptual Bridge
Before diving into the formal mathematics, let's build a strong conceptual link between the Laplace and Fourier transforms. Your background in signal processing has given you a solid foundation in both, and seeing them as parts of a greater whole is enlightening.
The Laplace transform variable is a complex frequency . The term acts as a probe. It analyzes a function's content in terms of both pure sinusoids () and exponentially decaying or growing sinusoids (). The resulting transform exists on a two-dimensional complex plane, the s-plane.
The Fourier transform, on the other hand, only uses pure sinusoids () as its basis. This is equivalent to setting the real part of the complex frequency, , to zero. In other words, the Fourier transform is a special case of the bilateral Laplace transform where , confined to the imaginary axis of the s-plane.
This video offers an excellent visualization of this very concept.
What does the Laplace Transform really tell us? A visual explanation (plus applications)
The video 'What does the Laplace Transform really tell us?' by Zach Star provides a superb visual explanation of how the Fourier transform can be seen as a 'slice' of the Laplace transform.
Please watch from 4:47 to 8:14. Focus on the visual argument that the imaginary axis of the Laplace transform's input plane corresponds to the Fourier transform. This provides the intuition for why we evaluate H(s) along s=jω to get frequency information.
This visualization suggests that all the information about a system's response to pure sinusoids should be contained within its transfer function right on the axis. Now, let's prove this rigorously.
2. The Formal Derivation: From H(s) to Steady-State Response
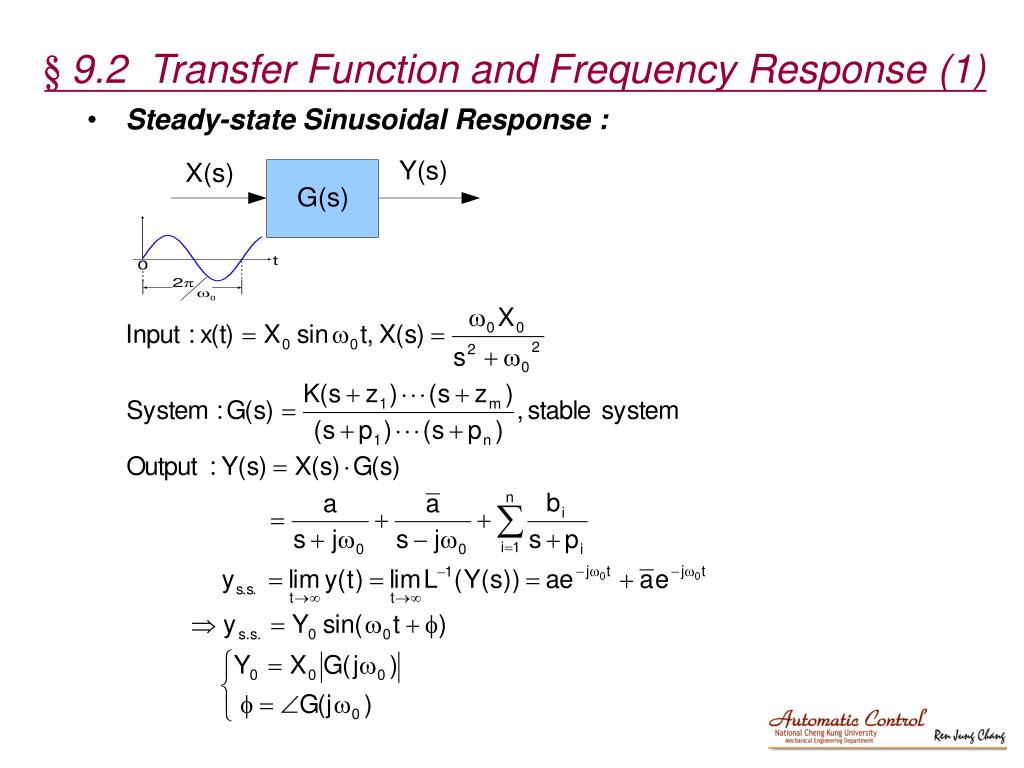
Our objective is to prove that for a stable LTI system with transfer function and a sinusoidal input , the steady-state output will be .
This derivation is a classic piece of signals and systems analysis. The following resource provides a step-by-step mathematical argument that we will replicate and explain here.
Frequency-Response Function from Transfer Function
The webpage 'Frequency-Response Function from Transfer Function' from LibreTexts Engineering provides a rigorous derivation of the relationship we are exploring. It's an excellent resource for a deep mathematical treatment.
This text provides the formal backbone for our derivation. You don't need to read it separately right now, as we will walk through the steps, but it serves as an excellent reference for the equations we are about to develop.
Let's proceed with the derivation, step-by-step.
Step 1: Define the Input and System in the s-Domain
- System: A stable, linear time-invariant (LTI) system is characterized by its transfer function , where we assume all initial conditions are zero.
- Input: We consider a general sinusoidal input, . Using Euler's formula, we can write this in a form more suitable for Laplace transformation:
- Input Transform: Using the standard transform pair , the Laplace transform of the input is:
Step 2: Determine the Output Transform Y(s)
The output transform is simply the product of the input transform and the system's transfer function:
To find the time-domain output , we must find the inverse Laplace transform of . This requires a partial fraction expansion. The poles of come from two sources:
- The poles of the input, at and .
- The poles of the system, which are the roots of the denominator of . Let's call these .
The partial fraction expansion will therefore have the form:
(Note: The second coefficient must be the complex conjugate because the time-domain signal is real.)
Step 3: Isolate the Steady-State Response
The inverse Laplace transform of the full expression for gives the total response:
Here is where the stability of the system is critical. For a stable system, all of its poles lie in the left half of the s-plane, meaning for all . Consequently, every term in the natural response, , contains a decaying exponential factor and will approach zero as .
The frequency response specifically describes the sinusoidal steady-state behavior of the system, which is what remains after all transients have died out. Therefore, we are only interested in the first two terms:
Step 4: Calculate the Coefficient C
To find , we just need to find the complex coefficient . We can do this using the Heaviside cover-up method for partial fraction expansion:
Substituting the expression for :
Distributing the term inside the parenthesis:
Now, we evaluate this expression by setting . The fractional term becomes zero.
Step 5: Reconstruct the Time-Domain Output
Now we substitute this result for back into our expression for . The complex value can be represented in polar form as:
Let's denote the phase . Then and its conjugate is .
Substituting these into the equation for :
Factoring out the common terms:
The expression in the parentheses is simply the definition of cosine. This gives us our final, powerful result:
This derivation proves that the steady-state output of a stable LTI system to a sinusoidal input is also a sinusoid of the same frequency, but with its amplitude multiplied by and its phase shifted by .
The complex function completely defines this relationship for all frequencies and is therefore rightfully called the frequency response function.
The image below provides a concise summary of this entire derivation.
Test your understanding!
Consider a simple RC low-pass filter with a transfer function . Let R = 1 k and C = 1 F, so the time constant s. The transfer function is .
- What is the frequency response function, ?
- An input voltage V is applied. The input frequency is rad/s, which happens to be the "corner frequency" () of this filter. What is the steady-state output voltage ?
Show answer
-
The frequency response is found by substituting into :
-
To find the steady-state output, we need to evaluate at the input frequency rad/s.
Now, we find the magnitude and phase of this complex number:- Magnitude:
- Phase: or radians.
The output will be .
With , we get:
As expected for a low-pass filter at its corner frequency, the amplitude is attenuated by a factor of and the phase is shifted by -45 degrees.
Conclusion
Today we have rigorously proven one of the most useful results in LTI system theory. By starting with a sinusoidal input and tracing its path through the system using Laplace transforms, we have formally derived the direct relationship between the s-domain transfer function and the frequency-domain response.
Key Takeaways:
- The frequency response is not just a convenient notation; it is the transfer function evaluated at , and this substitution is mathematically justified.
- The derivation relies on a partial fraction expansion of the output , separating it into transient terms (from system poles) and steady-state terms (from input poles).
- For a stable system, the transient terms decay to zero, leaving a purely sinusoidal steady-state response.
- The magnitude of the frequency response, , gives the gain (amplitude ratio) of the system at frequency .
- The phase of the frequency response, , gives the phase shift added by the system at frequency .
Preview of the Next Lesson:
Now that we have firmly established the link between and , we can focus on analyzing the frequency response itself. In the next lesson, we will delve into the characteristics of analog filters by examining their magnitude response, phase response, and a related concept called group delay. This will allow us to understand and predict how a system will shape signals in the frequency domain, a critical skill for filter design and analysis.