Hello! In our last lesson, we formally derived the Discrete-Time Fourier Transform (DTFT) and established its fundamental relationship to the Continuous-Time Fourier Transform (CTFT) of the original sampled signal. We concluded by proving that the DTFT is always periodic with a period of , a property stemming from the formula:
Today, we will move from simply stating this property to analyzing it in depth. Our goal is to understand why the DTFT spectrum is periodic from multiple angles and to explore the profound implications this has for digital signal processing. This periodicity is not a mere mathematical quirk; it is the very foundation of concepts like aliasing and the Nyquist sampling criterion.
1. The Mathematical Root of Periodicity
The periodicity of the DTFT, , arises directly from the properties of the complex exponential function with an integer index. Let's start with the definition of the DTFT:
The key is the term , where is always an integer. Let's see what happens if we shift the frequency by an integer multiple of , say for some integer .
The following video provides a concise mathematical proof of this property.
Properties of Discrete time Fourier transform (Part -1) in signals and systems || EC Academy
The video 'Properties of Discrete time Fourier transform' from EC Academy offers a clear, step-by-step mathematical proof of the periodicity property directly from the DTFT's definition.
Please watch the first part of the video, from the beginning until 03:21. Focus on how Euler's formula is used to show that the term e^{-j2\pi k n} simplifies to 1, which is the core of the proof.
As the video demonstrates, if we substitute into the complex exponential term, we get:
Using Euler's formula, the second term becomes:
Since both and are integers, their product is also an integer. The cosine of an integer multiple of is always 1, and the sine is always 0. Therefore, .
This proves that for any integer . When we substitute this back into the DTFT summation, it shows that the entire transform is periodic with period :
This intrinsic property distinguishes the DTFT from its continuous-time counterpart, which is generally aperiodic.
2. The Physical Origin of Periodicity: The Act of Sampling
While the direct proof shows that the DTFT is periodic, the relationship we derived in the last lesson explains why it becomes periodic: the process of sampling itself.
As a brief recap, sampling a continuous signal at intervals of creates a discrete sequence . The spectrum of this discrete sequence, its DTFT, is directly related to the spectrum of the original continuous signal, , through the Poisson summation formula. This formula provides a beautifully complete picture.
Discrete-time Fourier transform
The Wikipedia article on the Discrete-time Fourier transform provides a concise and mathematically rich explanation of this relationship, centered on the Poisson summation formula.
Please read the section 'Relation to Fourier Transform'. Pay close attention to: Eq. 2 (Poisson summation): This is the key formula showing the DTFT is a periodic summation of the original CTFT. Fig 1: This diagram is crucial. Observe how the original spectrum (top left) is replicated periodically to form the DTFT spectrum (bottom left).
The Poisson summation formula (Eq. 2 in the article) states:
This equation tells us that the DTFT spectrum ( in this notation) is not a new, unrelated entity. It is literally constructed by taking the original continuous-time spectrum , making infinite copies of it, and shifting each copy by an integer multiple of the sampling frequency, .
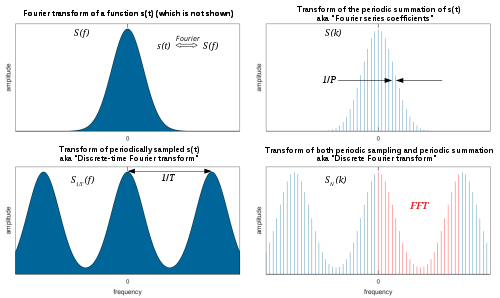
This figure from the Wikipedia article illustrates the creation of the periodic DTFT spectrum (bottom left) from the aperiodic CTFT spectrum (top left) through the process of sampling. The spacing of the spectral replicas is determined by the sampling frequency.
This process of "periodic summation" naturally creates a periodic function. This is the physical and conceptual reason behind the mathematical property we proved earlier. The discrete nature of the time-domain signal forces its frequency-domain representation to be continuous and periodic.
3. Key Implications of Periodicity
The -periodicity of the DTFT spectrum is not just a theoretical detail; it has profound practical consequences that shape the entire field of digital signal processing.
a) Redundancy and the Unique Frequency Range
Since the spectrum repeats every radians/sample, all the unique information about the signal's frequency content is contained within any single interval of length . By convention, we typically analyze the principal period from to . The spectrum outside this range is entirely redundant.
This leads to a different interpretation of "low" and "high" frequencies compared to the continuous-time domain:
- Low Frequencies: Frequencies near integer multiples of (e.g., ) correspond to slowly varying signals.
- High Frequencies: Frequencies near odd integer multiples of (e.g., ) correspond to rapidly varying signals. The highest unique frequency in a discrete-time signal occurs at .
THE DISCRETE-TIME FOURIER TRANSFORM
The textbook 'The Discrete-Time Fourier Transform' by Oppenheim and Willsky explains this distinction between low and high discrete-time frequencies very clearly.
Please read the two paragraphs on page 361-362, starting from 'As our derivation indicates...' and ending just before 'Example 5.1'. Pay special attention to Figure 5.3, which contrasts a low-frequency discrete signal with a high-frequency one and shows their respective periodic DTFTs.
b) Aliasing: The Problem of Ambiguity
The most critical implication of periodicity is aliasing. Because , it is impossible to distinguish between the frequency and any of its aliases , , etc., based on the sampled signal alone.
Let's connect this back to the continuous world. A continuous frequency maps to the discrete frequency . Now consider a higher continuous frequency , where is the sampling frequency. Its corresponding discrete frequency is:
After sampling, the continuous frequency is indistinguishable from . It has taken on the "alias" of the lower frequency. This is the phenomenon you observed in the exercise from the previous lesson, now explained through the structure of the DTFT.
This next video excellently illustrates how the periodic replication of the spectrum leads to aliasing if the sampling rate is not high enough.
The video 'Sampling Signals' provides a clear, visual explanation of how the spectral copies created by sampling can overlap, leading to aliasing.
Please watch from 02:24 to 06:57. Focus on: The visualization of the repeated spectra after convolution (02:24 - 04:44). The critical part where the presenter shows what happens when the spectral copies are too close and overlap (04:44 onwards). This overlap is aliasing, and it makes recovering the original signal impossible.
c) The Nyquist-Shannon Sampling Theorem Revisited
The problem of aliasing leads directly to its solution: the Nyquist-Shannon sampling theorem. The video you just watched explained it visually. The periodic nature of the DTFT demands that if we want to be able to perfectly reconstruct the original signal, the spectral copies created by sampling must not overlap.
For a signal band-limited to , its spectral width is . The copies are centered at integer multiples of the sampling frequency . To prevent overlap, the distance between the centers of adjacent copies () must be greater than the width of one copy ().
This is the famous Nyquist criterion, derived here as a direct consequence of avoiding the spectral overlap inherent in the DTFT's periodic structure.
Test your understanding!
A signal is sampled at Hz. We are interested in the discrete-time frequency representation of a Hz sinusoid contained in the signal.
- Calculate the discrete-time frequency for the 3000 Hz component. Express it in the principal range .
- An unwanted noise component is present at Hz. Calculate its discrete-time frequency .
- What do you observe about and ? Why does this happen?
Show answer
-
The sampling period is s. The continuous frequency is rad/s. The discrete frequency is rad/sample. This is in the principal range.
-
The continuous frequency of the noise is rad/s. The discrete frequency is rad/sample.
-
The frequency is outside the principal range . To find its alias within this range, we subtract a multiple of :
We observe that . The 11000 Hz noise component is aliased and appears at the exact same discrete-time frequency as the 3000 Hz signal component. This happens because the noise frequency Hz is related to the signal frequency Hz by the sampling rate: .
Conclusion
In this lesson, we took a deep dive into the periodicity of the DTFT. You saw how this fundamental property is both a direct mathematical consequence of the DTFT's definition and a physical consequence of the spectral replication caused by sampling.
Key Takeaways:
- The DTFT spectrum is always periodic with period , because the complex exponential kernel is itself periodic in for integer .
- Conceptually, this periodicity arises from the fact that sampling in the time domain creates infinite, uniformly-spaced replicas of the original signal's spectrum in the frequency domain.
- Implication 1: All unique frequency information is contained in the principal period, typically .
- Implication 2: Periodicity causes frequency ambiguity, or aliasing, where continuous frequencies separated by multiples of the sampling frequency () become indistinguishable after sampling.
- Implication 3: The Nyquist-Shannon sampling theorem () is the condition required to prevent the periodic spectral replicas from overlapping and causing aliasing.
Preview of the Next Lesson:
Having thoroughly analyzed the DTFT and its properties, we are now ready to generalize it. In the next lesson, we will derive the z-transform as a generalization of the DTFT. You will see that while the DTFT is confined to analyzing frequencies on the unit circle in the complex plane, the z-transform allows us to analyze the entire plane, providing powerful tools for understanding system stability and causality.