Hello! Welcome to our fifth lesson in the "Discrete-Time Signals and Systems" module.
In our last session, we derived the z-transform as a generalization of the Discrete-Time Fourier Transform (DTFT) and established the critical role of the Region of Convergence (ROC). We concluded that a signal's DTFT exists if and only if the ROC of its z-transform includes the unit circle.
Today, we will delve deeper into this fundamental connection. Our goal is to analyze the relationship between the z-plane unit circle and the DTFT frequency response. You will learn to visualize the z-transform's magnitude as a 3D surface and see how the system's frequency response is simply a cross-section of this surface taken along the path of the unit circle. This geometric perspective is incredibly powerful for understanding and designing discrete-time systems.
1. The Mathematical Connection: Evaluating the Z-Transform on the Unit Circle
Let's begin by solidifying the mathematical link we introduced last time. The definitions for the z-transform of a system's impulse response, , and its DTFT are:
- Z-Transform:
- DTFT (Frequency Response):
It's clear from these equations that if we take the z-transform expression and substitute the complex variable with , we get the DTFT.
The following short video provides an excellent summary of this exact point.
Relationship of the unit circle with a systems frequency response - z - transform part 5
The video 'Relationship of the unit circle with a systems frequency response' by David Dorran clearly derives the mathematical relationship and introduces the visual concept we will be exploring throughout this lesson.
Please watch this video from the beginning to end (00:00 - 02:59). Pay close attention to how it directly equates the DTFT with the z-transform evaluated at z=e^{j\omega} and introduces the idea of obtaining the frequency response by 'moving around the unit circle'.
2. The Geometry of Frequency: The Unit Circle
The substitution has a profound geometric meaning. A general complex number in the z-plane can be written in polar form as , where is the magnitude (distance from the origin) and is the angle (in radians) from the positive real axis.
When we set , we are fixing the magnitude to . The set of all complex numbers with a magnitude of 1 forms the unit circle.

This mapping directly connects discrete-time frequency to a physical location on the z-plane:
- DC (): This corresponds to , the point on the far right of the unit circle.
- Nyquist Frequency (): This corresponds to , the point on the far left of the unit circle.
- Negative Nyquist Frequency (): This also corresponds to . Moving clockwise from represents negative frequencies.
- Full Cycle (): This corresponds to , bringing us back to where we started. This journey around the circle is a beautiful geometric confirmation of the -periodicity of the DTFT we studied earlier.
The following reading reinforces these points clearly.
This section from the Wikipedia article on the Z-transform formally describes the relationship to the DTFT.
Please read the section 'Relationship to Fourier series and Fourier transform'. Focus on the initial paragraphs that introduce the substitution z=e^{j\omega} and explicitly state that this reduces the z-transform to the DTFT.
3. Visualizing the Frequency Response
Now, let's combine these ideas. The magnitude of the z-transform, , can be visualized as a 3D surface plotted over the complex z-plane. The value of is the height of the surface at the point .
This surface is shaped by the poles and zeros of :
- At a pole, the function goes to infinity, so the surface has an infinitely high peak.
- At a zero, the function is zero, so the surface touches the z-plane.
The DTFT magnitude response, , is simply the cross-section of this 3D surface along the unit circle.
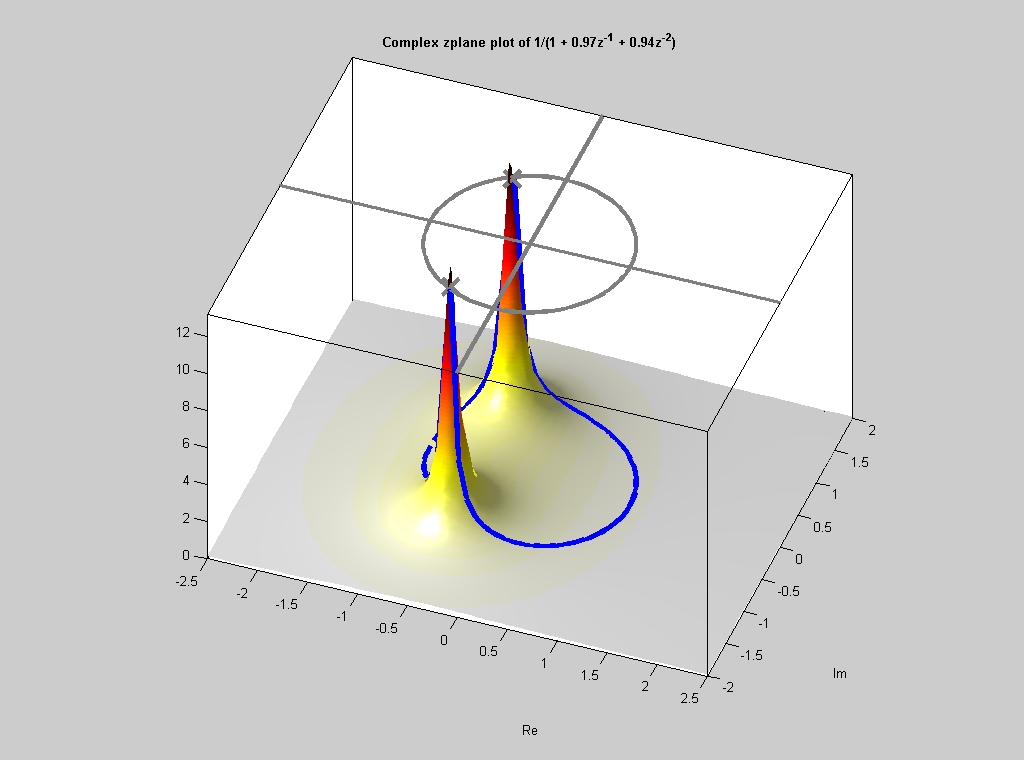
This visualization provides powerful intuition:
- If a pole is located close to the unit circle, the frequency response will have a sharp peak at the frequency corresponding to the pole's angle. The closer the pole is to the circle, the higher and sharper the peak.
- If a zero is located on or near the unit circle, the frequency response will have a null or dip at the corresponding frequency .
This geometric relationship is the foundation of analog and digital filter design, where poles and zeros are carefully placed to shape the frequency response of a system.
To see another perspective on this visualization, consider the following video.
Z Transform Region of Convergence Explained ("the best explanation in the internet!")
The video 'Z Transform Region of Convergence Explained' by Iain Explains offers a unique visualization of 'wrapping' the frequency response around the unit circle.
Watch from 02:42 to 06:39. This segment explains how the 1D frequency axis of the DTFT gets mapped onto the 2D unit circle in the z-plane. The key idea is to imagine the frequency response plot being lifted up and wrapped around the circle, with the peaks and nulls (represented as delta functions for a cosine wave in his example) sticking out from the circle at the appropriate angles.
4. Stability, ROC, and the Existence of a Frequency Response
We can now bring everything together. As you know from your background in continuous-time systems, a stable LTI system has an impulse response that is absolutely integrable. The discrete-time equivalent is that a stable system has an impulse response that is absolutely summable:
If this condition holds, then the DTFT sum is guaranteed to converge, because:
This ties directly back to the z-transform and the ROC. For the DTFT to exist, the z-transform sum must converge for , i.e., on the unit circle. This leads to a fundamental conclusion:
An LTI system is stable if and only if the ROC of its transfer function includes the unit circle.
The following readings formalize this critical link between the abstract ROC and the practical concepts of stability and frequency response.
Part I 1 Relation to Discrete-Time Fourier Transform
The document 'Relation to Discrete-Time Fourier Transform' from MIT, which you've seen before, contains several succinct sections that tie all of these concepts together.
Please read the following three short excerpts from this document: Start of Chunk 2: Find the paragraph starting with 'You may have noticed that in class...'. It explicitly states that the DTFT can only exist on the unit circle. Chunk 5: Find the paragraph starting with 'Does the DTFT exist for h1[n]?'. It formally states that the DTFT exists if the ROC includes the unit circle and links this to system stability (absolute summability). Property 3 in Chunk 8: Find 'Property 3' in the list under 'Properties of an ROC'. This is a concise summary of the link between absolute summability, the ROC containing the unit circle, the existence of the DTFT, and stability.
Test your understanding!
An LTI system has a transfer function . The system is known to be stable.
- What is the Region of Convergence (ROC) for this system?
- Based on the pole locations, what general shape would you expect for its frequency response ? Will it act more like a low-pass or high-pass filter?
Show answer
-
The poles are at and . Since the system is stable, the ROC must include the unit circle . The only way to form a valid ROC (an annulus bounded by poles) that contains the unit circle is for the ROC to be . This implies the signal must be two-sided.
-
The system has a pole at , which is inside the unit circle but close to it, near the real axis at . It also has a pole at , which is outside the unit circle. The pole at will have a much stronger influence on the frequency response because it is closer to the unit circle where the response is evaluated. Since this pole is at a low frequency (angle ), it will create a peak at or near DC. Therefore, we would expect the system to behave like a low-pass filter, amplifying low frequencies.
Conclusion
In this lesson, we established a robust and intuitive link between the z-plane and the frequency domain. By understanding the z-transform as a surface and the DTFT as a slice of that surface, you've gained a powerful tool for analyzing system behavior.
Key Takeaways:
- The DTFT of a signal is mathematically equivalent to its z-transform evaluated on the unit circle ().
- Discrete-time frequency corresponds to the angle on the unit circle, with at and at .
- The magnitude of the frequency response, , can be visualized as the cross-section of the 3D surface along the unit circle.
- Poles near the unit circle create peaks in the frequency response, while zeros create nulls. This proximity effect is the key to filter design.
- A system's frequency response exists and the system is stable if and only if the ROC of its z-transform, , includes the unit circle.
Preview of the Next Lesson:
Having established the fundamental concepts of the z-transform, the ROC, and the link to frequency response, we are now ready to put it to work. In the next lesson, we will explore the key properties of the z-transform (linearity, shift, convolution, etc.). This will give us the analytical machinery needed to efficiently analyze and solve problems involving discrete-time LTI systems, much as we did with Laplace transform properties for continuous-time systems.