Hello! Welcome to your next lesson in our journey through unsupervised learning.
In the previous lesson, we introduced Principal Component Analysis (PCA) and saw how to use it for dimensionality reduction. We used a handy feature in scikit-learn where we could set n_components=0.95 to automatically select the number of components needed to retain 95% of the data's variance.
This lesson dives into the "how" behind that number. Our goal is to explain the concept of explained variance in the context of PCA. You'll learn what it is, how it's calculated from the data, and how you can use it to make a deliberate and informed choice about the trade-off between reducing dimensions and preserving information. This is a key diagnostic skill for applying PCA effectively.
Let's get started.
1. The Core Idea: What is "Explained Variance"?
In the last lesson, we established that PCA finds new axes (principal components) that capture the maximum amount of "spread" or variance in the data. The first principal component (PC1) captures the most, PC2 captures the second most, and so on.
Explained variance is simply the percentage of the total variance in the original dataset that is captured by each principal component.
If PC1 has an explained variance of 70%, it means that this single new feature captures 70% of the information about the spread of our data. If we add PC2, which explains 20%, then together our two new features capture 90% of the total variance.
To build a solid intuition for this, let's return to the excellent StatQuest series.
StatQuest: Principal Component Analysis (PCA), Step-by-Step
This short clip from 'StatQuest: Principal Component Analysis (PCA), Step-by-Step' directly explains how explained variance is calculated and introduces the idea of a scree plot.
Please watch the segment from 15:06 to 16:20. Focus on how the total variation is calculated and how the variation of each principal component is expressed as a percentage of that total.
As the video explains, the variance captured by each principal component is quantified by a value called its eigenvalue (). The larger the eigenvalue, the more variance the component explains.
Therefore, the explained variance ratio for a specific component is calculated by dividing its eigenvalue by the sum of all eigenvalues:
Where is the total number of components (which is equal to the original number of features).
This formula is the mathematical heart of what we mean by "explained variance". Let's get another perspective on this that connects it more formally to the underlying linear algebra.
Principal Component Analysis (PCA)
The 'Visually Explained' channel offers a slightly more mathematical but still very intuitive walkthrough. This will reinforce the connection between eigenvalues and the information preserved by each component.
Watch from 01:54 to 06:06. Pay attention to how it concludes that the principal components are the eigenvectors of the data's covariance matrix, and that the corresponding eigenvalues represent the amount of information preserved. Notice how it arrives at the exact same conclusion: to find the percentage of data explained, you divide each eigenvalue by their sum.
2. Visualizing and Interpreting Explained Variance
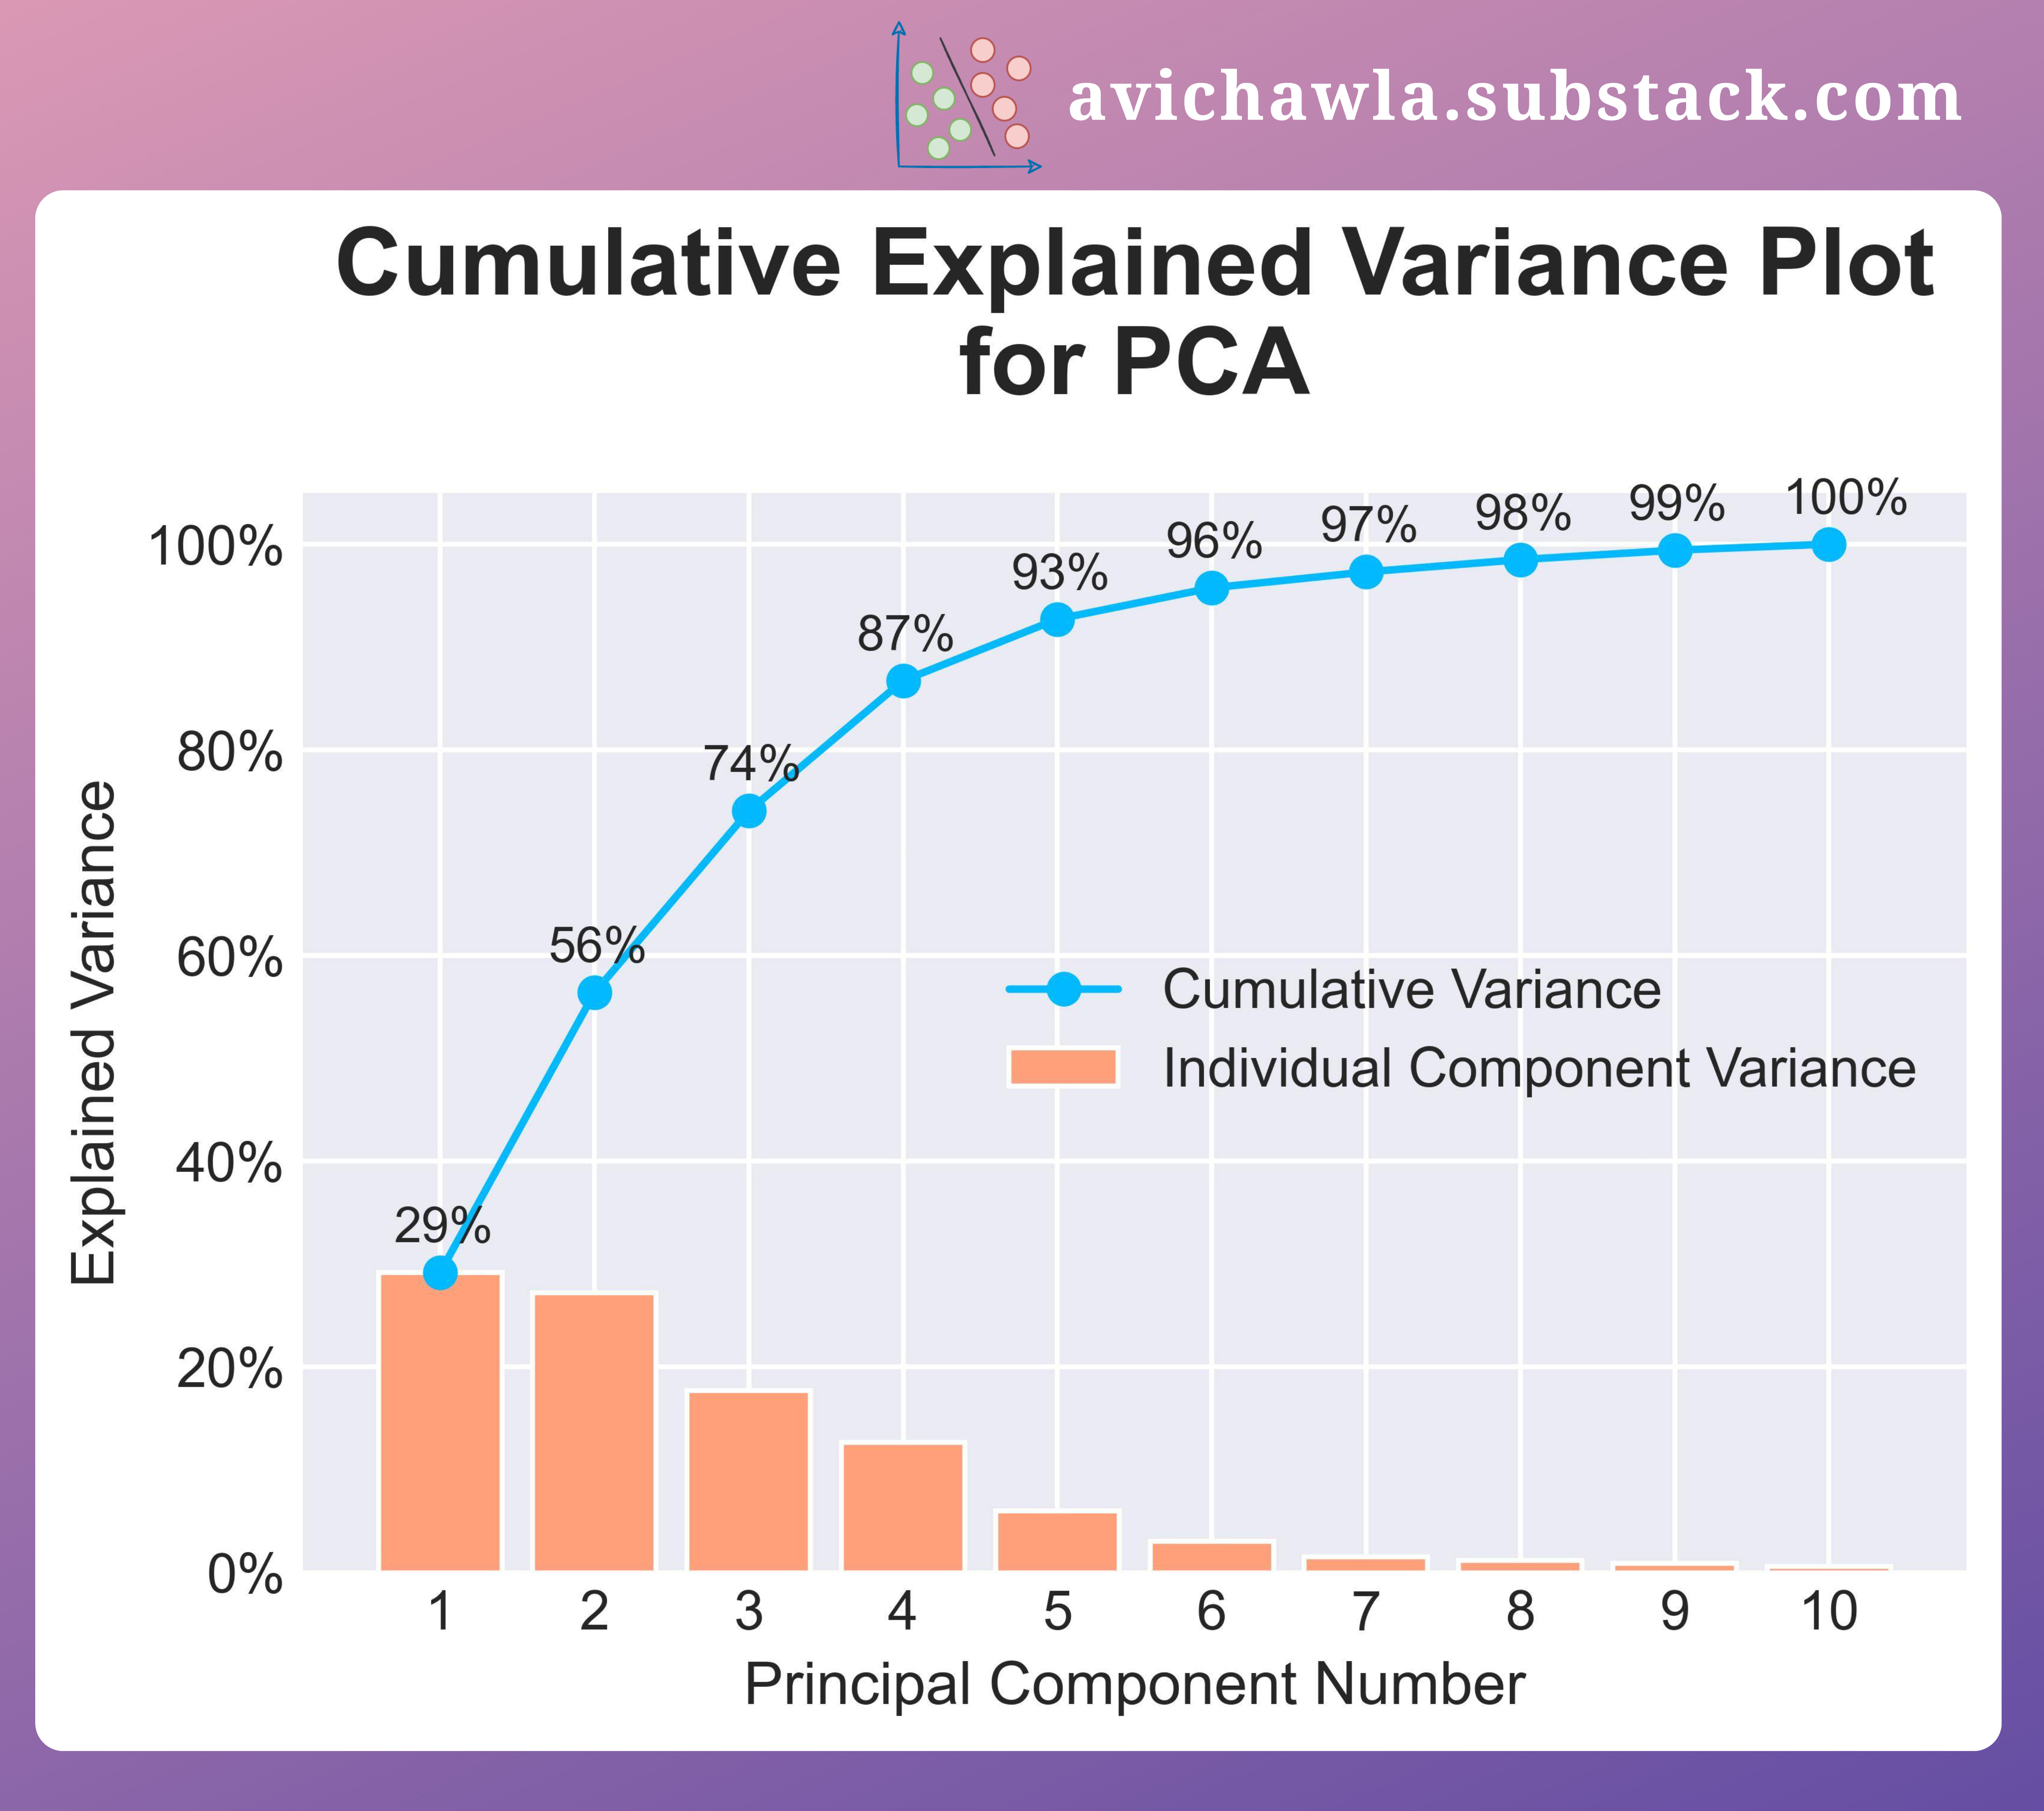
Knowing the formula is one thing; using it is another. In practice, we rarely calculate this by hand. Instead, we use visualizations to help us decide how many components to keep. The two most common plots are the Scree Plot and the Cumulative Explained Variance Plot.
- Scree Plot: A bar chart showing the explained variance for each individual principal component, sorted in descending order. It helps you see the point of "diminishing returns," where adding more components doesn't add much new information.
- Cumulative Explained Variance Plot: A line plot showing the total variance explained as you add components one by one. This plot directly answers the question, "How many components do I need to capture X% of the variance?"
The following article provides a great hands-on guide to creating and interpreting these plots.
Principal Component Analysis (PCA) Made Easy - Medium
This Medium article, 'Principal Component Analysis (PCA) Made Easy', gives clear definitions and practical Python code for generating these essential plots.
Please read the section titled 'Choosing the Right Number of Principal Components in PCA'. Focus on: The definition of the Explained Variance Ratio. The explanation of the Cumulative Variance Plot and how to interpret it. The explanation of the Scree Plot and the concept of the 'elbow point'. Review the Python code block that generates both plots. This shows how to access the explained_variance_ratio_ attribute from a fitted PCA object in scikit-learn.
To make this even more concrete, here is an example of a plot that combines both visualizations.
3. Making the Decision: How Many Components to Keep?
You now have the tools to make an informed decision. The number of components you choose is a trade-off.
- Too few components: You risk losing important information, potentially hurting the performance of any subsequent machine learning model.
- Too many components: You retain most of the information but gain little in terms of dimensionality reduction, defeating the purpose of PCA.
Here are two common strategies for choosing the optimal number:
1. The Threshold Method:
This is what we implicitly did in the last lesson. You set a threshold (e.g., 95%) and keep the smallest number of components required to meet it. This is the most common approach when PCA is used for preprocessing before feeding data into another model. The cumulative explained variance plot is your best tool here.
The following article shows the code for implementing this logic.
Principal Component Analysis Made Easy: A Step-by-Step Tutorial
This article, 'Principal Component Analysis Made Easy: A Step-by-Step Tutorial', demonstrates how to find the optimal number of components based on a variance threshold.
Read section '4. Evaluation and interpretation'. Focus on the code that calculates and plots the cumulative sum of variance to find the number of dimensions that achieve 95% of the total variance.
2. The Elbow Method (using the Scree Plot):
You look at the scree plot and find the "elbow"—the point where the explained variance of subsequent components drops off and the curve flattens. The components before the elbow are considered the most significant ones to retain. This method is more of a heuristic but is very useful for getting a quick sense of the data's intrinsic dimensionality.
Let's see one final example of how this is applied when deciding whether a 2D plot is a good representation of a high-dimensional dataset.
StatQuest: Principal Component Analysis (PCA), Step-by-Step
We return one last time to the StatQuest PCA video to see how explained variance justifies the visualization of high-dimensional data.
Watch the final segment from 18:08 to 21:05. Notice how for a 4-gene (4D) dataset, the scree plot shows that PC1 and PC2 account for 90% of the variation, giving confidence that a 2D graph using only these two components is a meaningful and accurate representation of the data.
Conclusion
Excellent work! You've now unpacked one of the most important concepts in PCA. Understanding explained variance moves you from being a user of a black-box algorithm to an informed practitioner who can diagnose and justify your modeling choices.
Key Takeaways:
- Explained variance is the proportion of a dataset's total variance that is captured by a principal component.
- It is calculated from the eigenvalues associated with each component. In
scikit-learn, this is accessible via the.explained_variance_ratio_attribute after fitting a PCA model. - We use a Scree Plot to see the variance of individual components and a Cumulative Explained Variance Plot to see the total variance captured as we add more components.
- These plots allow us to make an informed decision about the number of components to keep, either by setting a variance threshold (e.g., 95%) or finding the "elbow" in the scree plot.
Preview of the next lesson:
In this lesson, we confirmed that checking the explained variance is crucial before deciding to visualize data in a lower dimension. In our next lesson, we will put this into practice and focus on the final step: visualizing high-dimensional data in two dimensions using PCA. We will apply what we've learned to create, interpret, and label these powerful visualizations.