Hello! Welcome to the sixth lesson in our module on Advanced C Programming & System Memory.
In our last lesson, we built a fixed-block memory pool allocator, a powerful tool for deterministic memory management. Building custom allocators is an advanced skill, but it also brings the responsibility of managing memory correctly. Mismanagement leads to some of the most subtle and dangerous bugs in C.
This lesson directly addresses the learning outcome: Identify and fix dangling pointer, wild pointer, double-free, and memory leak bugs in C code samples. Mastering these concepts is non-negotiable for any senior embedded role, as these bugs can cause system instability, crashes, and critical security vulnerabilities. Expect to be tested on your ability to spot and solve them in coding interviews.
We will systematically explore four major classes of memory management errors:
- Memory Leaks: Forgetting to return what you've borrowed.
- Dangling Pointers (Use-After-Free): Using a pointer to memory that has already been returned.
- Double-Free: Returning the same memory block more than once.
- Wild Pointers: Using a pointer that was never properly initialized.
A Powerful Tool: Valgrind
Before we dissect these bugs, let's introduce the primary tool we'll use to detect them: Valgrind. In an interview, knowing the bug patterns is good, but knowing the professional-grade tools to find them is even better.
Valgrind is a dynamic analysis tool suite. Its Memcheck tool runs your program in a virtual CPU and monitors every single memory access. It can detect a wide range of memory errors with remarkable accuracy, making it an indispensable part of a C developer's toolkit.
C Dynamic Memory Debugging with Valgrind
To start, let's get a brief overview of what Valgrind is and how to use it. This video by Brian Fraser provides a concise introduction.
Watch the segment from 1:36 to 3:03. Pay attention to how Valgrind works at a high level (running code in a VM) and the importance of compiling with the -g flag to get meaningful debug information.
Now, let's apply this tool to hunt down our bugs.
1. Memory Leaks
A memory leak occurs when you allocate memory on the heap (e.g., with malloc) but fail to deallocate it, while also losing the only pointer to that memory. The program "forgets" about the allocated block, which can never be used again or freed, consuming resources until the program terminates.
Common Cause: Re-assigning a pointer before freeing the memory it previously pointed to.
// Mistake #11 from the "Top 20 C pointer mistakes" article
void memory_leak_example() {
    // Memory block 1 is allocated and its address is stored in p.
    int* p = (int*)malloc(sizeof(int));
    *p = 5;

    // Memory block 2 is allocated. The address of block 2 overwrites
    // the address of block 1 in p. We have now lost our only handle to block 1.
    p = (int*)malloc(sizeof(int));

    // We can free block 2, but block 1 is leaked forever.
    free(p);
}
Detection and Fix:
Valgrind excels at finding leaks. Let's see how it reports this issue and how to fix it.
C Dynamic Memory Debugging with Valgrind
The following clip from the same Valgrind video demonstrates a classic memory leak and how to interpret Valgrind's leak summary.
Watch from 3:39 to 9:07. Notice how Valgrind's leak summary clearly states that 12 bytes are 'definitely lost' and points to the malloc call that caused it. The fix is straightforward: ensure every allocation has a corresponding free.
The simple rule is: for every malloc, there must be a free. In complex systems, tracking ownership of allocated memory becomes crucial to ensure the responsible party frees it.
2. Dangling Pointers (Use-After-Free)
This is one of the most severe memory bugs. A dangling pointer points to a memory location that has been deallocated. Using this pointer (reading from or writing to it) results in undefined behavior. The memory might contain garbage, or worse, it might have been re-allocated for a completely different purpose, leading to silent data corruption.
There are three primary ways to create a dangling pointer.
Dangling Pointer In C Language Demystified
This article from Unstop provides a clear definition and examples of the main causes of dangling pointers.
Please read the following sections to understand the three main scenarios: Deallocation of Memory: Start at "Reasons For Occurance..." and read through the first code example showing a pointer used after free(). Variable Goes Out of Scope: Read the section titled "Creation Of Dangling Pointer In C When Variable Goes Out Of Scope". Function Call Return: Read the section "Creation Of Dandling Pointers In C & Function Call". This is a classic interview trap.
Cause 1: Access After free()
This is the most direct cause. You free a block of memory, but continue to use the pointer that pointed to it.
void use_after_free_example() {
    int* p = (int*)malloc(sizeof(int));
    *p = 123;
    printf("Value before free: %d\n", *p);

    free(p); // p is now a dangling pointer.

    // UNDEFINED BEHAVIOR! This might print 123, garbage, or crash.
    printf("Value after free: %d\n", *p);
}
Detection and The "Why":
Let's see how Valgrind catches this and then look deeper at why it's so dangerous.
C Dynamic Memory Debugging with Valgrind
First, let's see how Valgrind flags this error.
Watch the segment from 10:03 to 11:52. Valgrind reports an 'invalid write' and helpfully tells you the block was 'freed'. This is a direct sign of a use-after-free bug.
Now, why is this so bad? The heap manager may reuse that freed memory immediately. Let's watch a video that uses GDB to visualize this dangerous interaction.
The Heap: How do use-after-free exploits work? - bin 0x16
This video from LiveOverflow takes a security perspective, showing how a use-after-free can be exploited. It provides excellent insight into the heap's state.
Watch the following segments: The Bug (2:42 - 3:10): Note how free() is called, but the pointer auth is not cleared. The Re-allocation (3:10 - 4:07): See how a strdup (which calls malloc internally) re-allocates the exact same memory block. The GDB View (4:07 - 8:02): This is the core of the video. Observe how the service allocation corrupts the data of the now-dangling auth pointer. This visualization is key to understanding the danger.
The Fix: The most robust defense is to nullify the pointer immediately after freeing it. A dereference of a NULL pointer will cause an immediate, obvious crash (on most systems), which is far better than silent data corruption.
// Corrected code
free(p);
p = NULL; // Now p is no longer dangling.

if (p != NULL) {
    // This code is now correctly skipped.
    printf("Value after free: %d\n", *p);
}
Cause 2: Returning a Pointer to a Local Variable
When a function exits, its local (stack) variables are destroyed. If you return a pointer to such a variable, that pointer becomes dangling the instant the function returns.
// A classic error
int* dangling_return_example() {
    int local_var = 42;
    // ERROR: returning address of a variable that will be
    // destroyed when the function returns.
    return &local_var;
}

void use_dangling_return() {
    int* dangling_ptr = dangling_return_example();
    // UNDEFINED BEHAVIOR: local_var's memory on the stack may have been
    // overwritten by something else (e.g., printf's own stack frame).
    printf("Dangling value: %d\n", *dangling_ptr);
}
Valgrind is also excellent at detecting this, often reporting "conditional jump or move depends on uninitialized value(s)" because you're reading from a dead part of the stack.
The Fix: A function should only return pointers to:
- Memory allocated on the heap (e.g., with
malloc). - Memory passed into it by the caller.
- A global or
staticvariable.
3. Double-Free
This error occurs when you call free() on the same memory block more than once. At best, this will cause your program to crash. At worst, it can corrupt the heap's internal data structures, leading to exploitable security vulnerabilities.
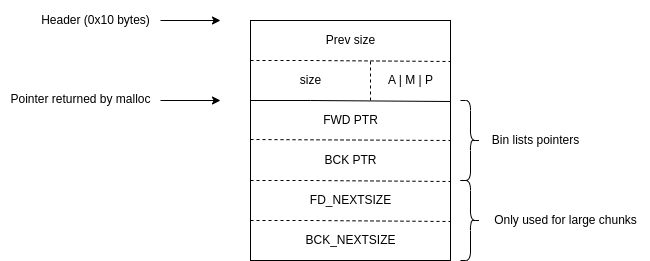
When you call free() a second time, the heap manager might try to manipulate these FWD/BCK pointers again, corrupting the free list. A subsequent malloc call could then get a bogus address or go into an infinite loop.
Detection and Fix:
C Dynamic Memory Debugging with Valgrind
Let's see how this error manifests. It's often an immediate crash, but Valgrind will also catch it.
Watch the short clip from 9:07 to 10:03. The program crashes with a "double free or corruption" error. Valgrind would provide a similar, more detailed report.
The Fix: This has the same solution as use-after-free. Setting the pointer to NULL after the first free() is a robust safeguard. The free() function in standard C libraries is guaranteed to do nothing when passed a NULL pointer.
char* str = (char*)malloc(10);
// ... use str ...
free(str);
str = NULL; // Nullify the pointer

// ... later in the code ...
free(str); // This is now safe, as free(NULL) is a no-op.
4. Wild Pointers
A wild pointer is one that has not been initialized. It holds a garbage address. Attempting to dereference it reads from or, much worse, writes to a random memory location, leading to immediate crashes or the most difficult-to-diagnose data corruption.
Top 20 C pointer mistakes and how to fix them
The following article gives a clear example of this fundamental mistake.
Read Mistake #2: Using uninitialized pointers. The fix is simple but critical.
The Fix: Always initialize your pointers. If you don't have a valid memory address to assign at declaration, initialize it to NULL.
// Unsafe: p is wild
int *p;

// Safe: p is initialized to a known, non-dereferenceable value
int *p_safe = NULL;

// Safe: p is initialized to a valid address
int x = 10;
int *p_valid = &x;
Conclusion
Mastering memory management is a hallmark of an expert C programmer. The bugs we've covered today are common but can be systematically prevented and debugged.
Key Takeaways:
- Memory Leaks: Every
mallocneeds afree. Use Valgrind's leak summary to find them. - Dangling Pointers (Use-After-Free): The most dangerous bug. It's caused by using pointers to freed memory or out-of-scope stack variables. Leads to silent corruption.
- Double-Free: A critical error that corrupts heap metadata.
- Wild Pointers: Uninitialized pointers are ticking time bombs.
- The Golden Rule: After calling
free(p), immediately setp = NULL;. This one habit mitigates both use-after-free and double-free errors, turning subtle corruption bugs into immediate, debuggable crashes.
In our next lesson, we will continue our deep dive into pointer-related topics by examining how the compiler thinks about them. We will explore the learning outcome: Explain pointer aliasing problems and apply the restrict keyword to enable compiler optimizations in performance-critical code. This will connect our understanding of memory safety to performance optimization.