Hello! Welcome back to our module on "Advanced Debugging and System Profiling."
In the last lesson, we mastered the fundamentals of on-chip debugging with JTAG/SWD. You learned how to use a debugger and GDB to control program execution and inspect the system's state—its memory and CPU registers. Those skills are the foundational tools for any serious embedded work.
Now, we move from controlled inspection to crisis management. What happens when the system crashes unexpectedly? In an interview at a company like NVIDIA or Qualcomm, you'll be expected to demonstrate a deep understanding of the CPU's architecture to solve such problems. Simply knowing how to set a breakpoint isn't enough; you must be able to perform a "digital autopsy" on a crashed system. This lesson will equip you with that exact skill.
Your learning outcome for this lesson is to: Perform a post-mortem hard fault analysis by reading the stacked exception frame (LR, PC, PSR) to find the faulting instruction.
We will dissect the ARM Cortex-M fault handling mechanism, learn what the processor does automatically when something goes wrong, and use our GDB skills to systematically decode the state left behind to pinpoint the root cause of the crash.
1. The Anatomy of a Crash: Faults on ARM Cortex-M
When your program attempts an illegal operation—like accessing a non-existent memory address, dividing by zero, or executing an invalid instruction—the ARM Cortex-M processor triggers a precise hardware exception.
There are three main types of configurable faults:
- BusFault: An error during a memory access on the bus (e.g., trying to read from an invalid address).
- MemManageFault (Memory Management Fault): A memory protection violation, typically triggered by the Memory Protection Unit (MPU). For example, trying to write to a read-only region.
- UsageFault: Catches various other errors, like executing an undefined instruction, unaligned memory access, or division by zero.
A HardFault is the ultimate fallback exception. It's triggered if one of the other faults occurs but its specific handler is disabled, or if a fault occurs within another exception handler. For post-mortem analysis, our entry point is almost always the HardFault_Handler.
To begin, let's get a high-level overview of the different fault types and the general strategy for debugging them.
How to Debug HardFaults on ARM Cortex-M MCUs
The video 'How to Debug HardFaults on ARM Cortex-M MCUs' from Memfault provides an excellent introduction to the Cortex-M fault architecture and why debugging them is crucial.
Please watch the following segments: Introduction & Why We Care (00:00 - 02:40): This sets the stage for why HardFault analysis is a critical skill for developing reliable products. Initial Debug Strategy (02:40 - 06:05): Focus on the importance of having a debugger connected and the general flow of a fault. Fault Types & Status Registers (06:05 - 10:07): Pay close attention to the descriptions of Usage, Bus, and MemManage faults, and the introduction of the Configurable Fault Status Register (CFSR).
First Clues: The Fault Status Registers
Your first step in any analysis is to read the CPU's fault status registers. These provide immediate clues about what went wrong. For Cortex-M3/M4/M7, the most important is the Configurable Fault Status Register (CFSR) at address 0xE000ED28.
The Memfault article provides a detailed reference for these registers. You don't need to memorize every bit, but you should understand what kind of information they hold.
How to debug a HardFault on an ARM Cortex-M MCU
The article 'How to debug a HardFault on an ARM Cortex-M MCU' serves as an excellent written reference. We'll use it to get a detailed look at the status registers.
Read the section 'Relevant Status Registers,' focusing on the descriptions of the UsageFault (UFSR), BusFault (BFSR), and MemManage (MMFSR) Status Registers. Note flags like BFARVALID (Bus Fault Address Register is valid), IMPRECISERR (Imprecise Error), UNALIGNED, and DIVBYZERO.
In GDB, you can inspect the entire 32-bit CFSR like this:p/x *(uint32_t *) 0xE000ED28
This value immediately tells you if you're dealing with a bus fault, usage fault, etc., guiding your next steps.
2. The Exception Frame: The Processor's "Black Box"
When a fault occurs, you'll hit a breakpoint in HardFault_Handler, but a standard GDB backtrace will be useless. It will only show HardFault_Handler because the processor has switched from its normal "Thread mode" to a special "Handler mode," losing the original context.
So where did the state of the program before the crash go? The CPU automatically saves it onto the stack. This saved block of data is called the exception stack frame.
This automatic hardware stacking is the key to all post-mortem analysis.
ARM Cortex M3/M4: Stacking and Un-Stacking during exception
The video 'ARM Cortex M3/M4: Stacking and Un-Stacking' offers a quick, clear visualization of how the processor automatically pushes registers onto the stack during an exception.
Watch the entire short video (00:13 - 02:22) to see an animation of the stacking and unstacking process. This will help you visualize what the hardware is doing.
The hardware always pushes the same 8 registers onto the stack that was active just before the fault:
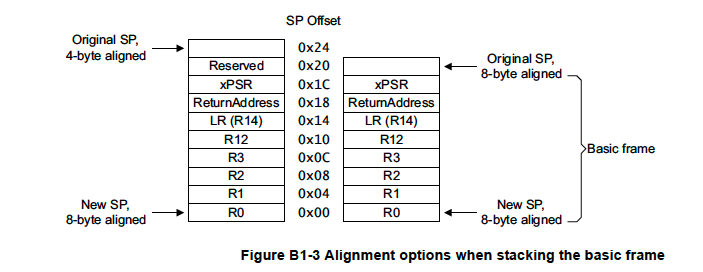
The registers saved are:
R0,R1,R2,R3: General-purpose scratch registers.R12: The intra-procedure-call scratch register.LR(Link Register): The pre-exception Link Register value.PC(Program Counter): The pre-exception Program Counter, which is the address of the instruction that caused the fault (or the one immediately after). This is our smoking gun.xPSR(Program Status Register): Contains the pre-exception processor status flags (Negative, Zero, Carry, etc.).
Our entire goal is to locate this frame in memory and extract the PC.
3. The Post-Mortem Procedure in GDB
Let's put this all together into a repeatable, step-by-step process. Assume you have a program that crashes, and your debugger is halted inside HardFault_Handler.

Here is the manual procedure to find the faulting line of code.
Step 1: Which Stack Was Used? (MSP vs. PSP)
A Cortex-M CPU has two stack pointers: the Main Stack Pointer (MSP) and the Process Stack Pointer (PSP). The MSP is typically used by the OS kernel and interrupt handlers, while the PSP is used by user tasks. The exception frame is pushed onto whichever stack was active before the fault.
How do we know which one? The LR register holds a special value called EXC_RETURN when in an exception handler. Bit 2 of EXC_RETURN tells us which stack pointer to use.
- If
bit[2] == 0, theMSPwas used. - If
bit[2] == 1, thePSPwas used.
In GDB, once halted in the handler:
- Check the
LR:p/x $lr - Inspect bit 2. If the value is, for example,
0xFFFFFFF9, the last hex digit9is1001in binary. Bit 2 is0. So, use theMSP. If the value were0xFFFFFFFD, the last digitDis1101. Bit 2 is1. So, use thePSP.
Step 2: Locate the Exception Frame
Once you know which stack pointer was active (e.g., PSP), get its current value. At the moment of entry into the handler, this register points directly to the start of the stacked frame.
- In GDB, print the value of the active stack pointer:
p $psp(orp $msp). - This gives you the memory address of the exception frame.
Step 3: Read the Stacked Registers and Find the PC
Now, use the examine (x) command to view the contents of the stack frame.
- Use the address from Step 2:
x/8xw <address_of_psp>- This command means "examine 8 hexadecimal words at this address".
- The output is a list of 8 memory words. Using the stack frame diagram, you can identify each one. The 7th value (at offset +24 bytes) is the crucial stacked Program Counter (
PC).
Step 4: Map the PC to Source Code
You now have the memory address of the instruction that caused the crash. GDB can map this back to your source code.
- Use the
listcommand with the stacked PC value:list *<stacked_pc_value> - GDB will show you the exact line of C code that corresponds to that address, revealing the source of the crash.
This entire manual process is demonstrated clearly in the Memfault video.
How to Debug HardFaults on ARM Cortex-M MCUs
Let's return to the Memfault video to see the complete manual analysis process in action, connecting all the theory we've just discussed.
Watch these crucial segments carefully: The Problem with Backtraces & Cortex-M Architecture (10:07 - 14:22): This explains why the context is lost and introduces the concepts of Thread/Handler modes, MSP/PSP, and the register calling convention that the exception hardware follows. Hardware Stacking and Decoding (14:22 - 19:35): This is the core of the lesson. It shows exactly how the exception frame is pushed and how to interpret the xPSR and EXC_RETURN (in the LR) to find the active stack, its alignment, and ultimately unwind the frame to find the faulting function.
4. A Practical Example: Debugging a Stack Overflow (STKERR)
Let's analyze a common and tricky cause of hard faults: a stack overflow. If the stack pointer runs out of valid RAM, a fault can occur during the exception entry itself as the hardware tries to push the 8-register frame to an invalid address.
This triggers a BusFault with the STKERR (Stacking Error) bit set in the CFSR.
How to debug a HardFault on an ARM Cortex-M MCU
The Memfault article has an excellent, detailed walkthrough of debugging a STKERR. This is a fantastic example of applying our knowledge to a non-obvious failure mode.
Read the example section titled 'Fault Entry Exception'. Pay close attention to the analysis: The CFSR indicates a STKERR. The stack pointer itself is at an invalid address just below the start of RAM. This means the stacked frame itself is invalid because it was written to non-existent memory. The key insight: By examining the memory at the edge of valid RAM, you can see the corruption pattern left by the overflowing stack, which helps identify the culprit function.
This STKERR example highlights a critical point: sometimes the stacked PC is not the answer, and you must use the fault registers and memory state to deduce the root cause. This level of analysis is exactly what interviewers are looking for.
5. Automation and Field Analysis
Manually performing this analysis is great for learning, but in practice, you'll automate it. You can create GDB scripts (often in Python) to perform these steps automatically. You can also write a C fault handler that captures the stacked registers into a struct and saves them to a non-initialized RAM section, allowing you to analyze crashes that happen in the field, long after the device has reset.
This is a more advanced topic, but understanding the possibility is important. The SEGGER application note provides an excellent example of a C and Assembly handler that does just this.
[PDF] Application Note Analyzing HardFaults on Cortex-M CPU - SEGGER
The SEGGER Application Note shows a production-quality approach to handling hard faults by defining C structs to capture the state.
Quickly review these sections to see how a professional implementation looks: 'Advanced stack analyzing': Note the table of stacked registers and the explanation of EXC_RETURN. 'Advanced Hard Fault Handler' (Assembly): Skim the assembly code. Its only job is to determine the correct stack pointer (MSP or PSP) and pass it to a C function. 'Advanced Hard Fault Handler' (C Code): Look at the C code. Notice the struct definitions that mirror the exception frame and the fault registers. This is how you would programmatically capture all the relevant data for logging.
Conclusion
You now have the knowledge and a repeatable procedure to dissect a hard fault on a Cortex-M processor. This moves you beyond being a simple "code writer" and into the realm of a true systems engineer who understands the deep interaction between software and hardware.
Key Takeaways:
- A HardFault is the processor's response to an illegal operation. The CFSR provides the first clues to its nature (Bus, Usage, or Memory Management fault).
- When a fault occurs, the CPU automatically saves an 8-register exception frame (R0-R3, R12, LR, PC, xPSR) to the currently active stack.
- The key to post-mortem analysis is to find this frame and extract the stacked PC.
- The
EXC_RETURNvalue in theLRregister is critical for determining whether theMSPorPSPwas used before the fault. - The GDB commands
p,x, andlistare all you need to manually locate the frame and map the faulting address back to your source code.
Preview of the Next Lesson:
Debugging a crash is a reactive process. A more robust approach is to prevent crashes in the first place. In our next lesson, we will focus on a proactive technique: Implement stack overflow detection using stack painting or MPU/MMU-based guard regions. We will learn how to catch stack overflows before they cause a catastrophic hard fault.