Welcome to the final lesson of our first module, "Foundations of Spatial Epidemiology." Over the past three lessons, we have built a solid conceptual foundation. We started by defining the fundamental structures of spatial data—vector and raster. We then examined Coordinate Reference Systems, the frameworks that give our data a precise location on Earth. Most recently, we explored the diverse sources where we can find the health, population, and environmental data crucial for our analyses.
You now understand the "what," "where," and "where to find it" of spatial data. The final piece of the puzzle is the "how": what tools do we use to work with this data? This lesson directly addresses your goal of becoming proficient in both visual and programming-based approaches. We will describe the distinct roles of Graphical User Interface (GUI) software, like QGIS, and programming environments, like R, in a typical spatial analysis workflow.
By the end of this lesson, you will be able to explain the strengths and weaknesses of each approach and understand how they are often used together to conduct robust and reproducible spatial health research. This will set the stage perfectly for the upcoming modules, where you will dive into hands-on work with QGIS and R, respectively.
The Two Paradigms of Spatial Analysis
In the world of spatial analysis, there are two main ways to interact with data and tools: through a visual, "point-and-click" interface or through a text-based, "command-line" interface. Each has a distinct purpose and set of advantages.
- Graphical User Interface (GUI): This is software where you interact with the program using menus, buttons, and icons. You click to open a file, select a tool from a dropdown menu, and fill in dialogue boxes to run an analysis. For our purposes, the primary example is QGIS.
- Programming Environment: This involves writing code (or scripts) to tell the computer what to do. Instead of clicking a "Buffer" button, you would write a line of code like
st_buffer(my_data, dist = 500). Our tool for this is the R programming language, a powerhouse for statistical analysis.
Your goal is to become skilled in both, which is the standard for modern spatial epidemiologists. Let's break down the role of each.
The GUI Approach: Interactive and Visual with QGIS
QGIS is a free and open-source desktop GIS application. It allows you to visualize, edit, and analyze spatial data in an interactive environment. Think of it as a digital light table and a set of cartography tools all in one.
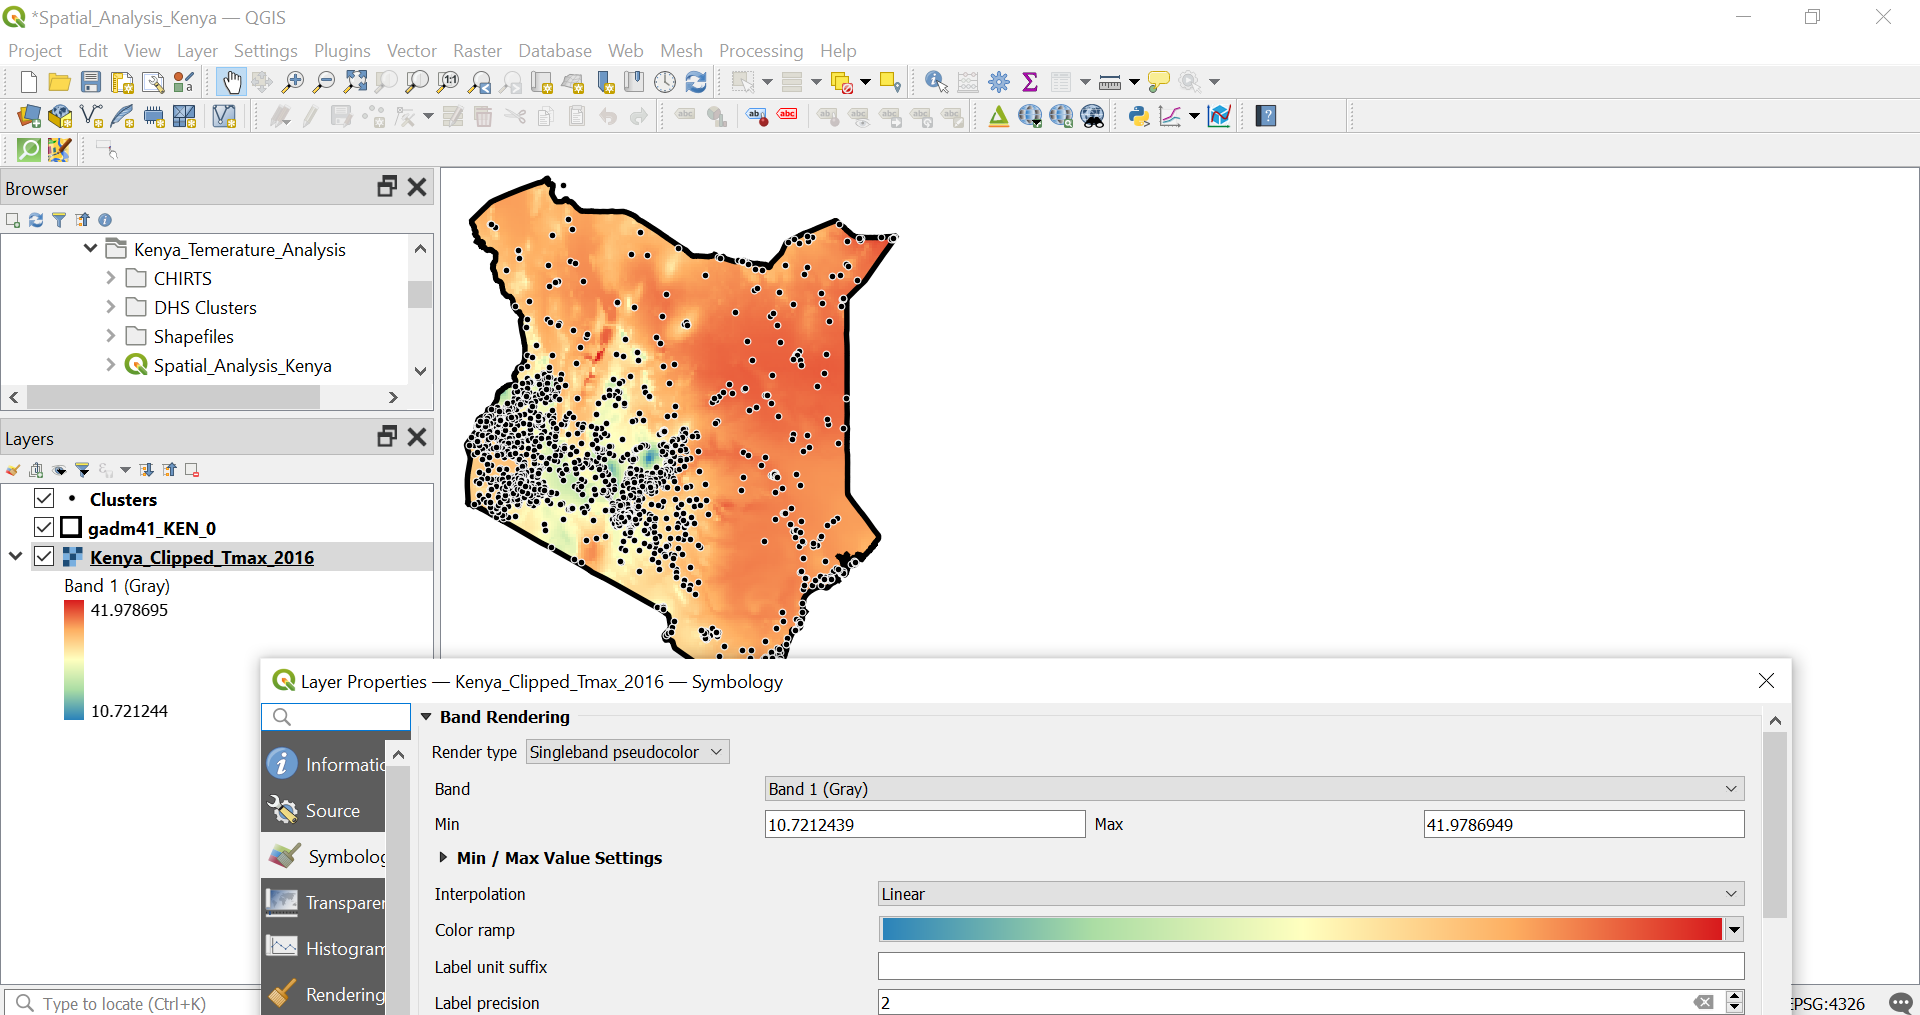
The following video from Matt Forrest gives a great overview of QGIS and its central role in the GIS landscape.
ArcGIS Is Holding You Back — Meet QGIS
This video, "ArcGIS Is Holding You Back — Meet QGIS," provides an excellent introduction to what QGIS is and why it is a foundational tool for modern GIS.
Please watch the first part of the video to get a clear sense of what a desktop GUI is and what its core strengths are. Focus on these segments: What is QGIS? This section defines QGIS as an open-source desktop application and explains its basic capabilities. Why should you care? This part highlights the key advantages, such as accessibility, community support, and its power as a visualization platform.
As the video explains, the primary strengths of a GUI like QGIS are:
- Ease of Use: The visual, point-and-click nature makes it intuitive and accessible, especially for beginners. You can explore data and try out tools without needing to learn a programming language first.
- Interactive Exploration: It excels at visual data exploration. You can pan and zoom around a map, click on individual features to see their attributes, and quickly get a feel for your dataset's spatial patterns.
- Rapid Visualization and Cartography: QGIS is fantastic for designing maps. You can easily experiment with different color schemes, symbols, and labels to create a clear and compelling visual representation of your data for reports or presentations.
However, this approach has limitations that are particularly important in a scientific context. The video below touches on these when discussing when not to use QGIS.
ArcGIS Is Holding You Back — Meet QGIS
Now, let's look at the other side of the coin: the limitations of a GUI-based workflow.
Please watch the section from the same video that discusses the pitfalls of QGIS and when other tools might be more appropriate. Pitfalls and limitations. Pay close attention to the discussion of performance with big data, the variability of plugins, and the general learning curve. When to use other tools. This part explicitly mentions using Python (or in our case, R) and spatial databases for large-scale data processing, which highlights the complementary nature of these tools.
The key weaknesses are:
- Lack of Reproducibility: It is difficult to precisely document a long series of clicks, menu selections, and parameter entries. This makes it challenging for another researcher—or even for you, six months later—to replicate your analysis exactly.
- Limited Scalability: GUI software can become slow or even crash when trying to process very large datasets (e.g., millions of patient records or high-resolution environmental data).
- Difficult to Automate: Performing the same sequence of operations on 100 different files would be incredibly tedious and error-prone.
These limitations are precisely where the programming approach shines.
The Programming Approach: Powerful and Reproducible with R
R is a programming language and free software environment for statistical computing and graphics. While its origins are in statistics, a vibrant community has developed a rich ecosystem of "packages" that extend its capabilities to virtually every field, including powerful tools for spatial analysis.
The following reading from The Epidemiologist R Handbook provides a concise comparison between the point-and-click and command-line approaches.
28 GIS basics - The Epidemiologist R Handbook
This section from a handbook designed for epidemiologists directly contrasts GUI tools with using R for spatial analysis.
Please read the subsection titled GIS software. It clearly lays out the trade-offs between the two approaches.
As the reading highlights, the "command-line interface" of R offers major advantages for scientific work:
- Reproducibility: An R script is a complete and unambiguous record of your entire analysis, from data import to final map. This script can be shared, and anyone can run it to get the exact same results. This is the gold standard for transparent and verifiable research.
- Automation and Scalability: A task that is tedious in a GUI (like processing 100 files) can be easily automated in R with a few lines of code. Programming is also far more efficient at handling the large datasets common in public health.
- Analytical Power: R gives you access to the entire universe of statistical methods. You can seamlessly integrate advanced statistical modeling, machine learning, and time-series analysis with your spatial data. Given your background in statistics, you will find R to be a natural environment for moving beyond simple mapping to sophisticated hypothesis testing and modeling of spatial health data.
Of course, the main challenge is the steeper learning curve. It takes time and practice to become comfortable writing code. This is why a staged approach, starting with QGIS and then moving to R, is so effective.
Bringing It All Together: A Hybrid Workflow
The most effective and common approach in modern spatial epidemiology is not to choose one tool over the other, but to use them together, leveraging the strengths of each at different stages of a project.
The flowchart below illustrates this perfectly.
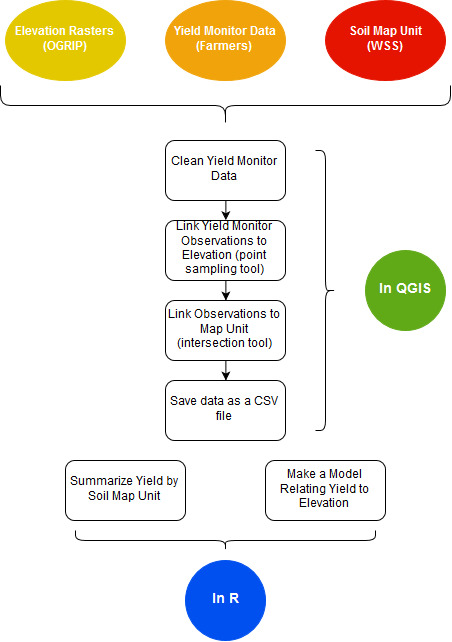
Let's walk through this hybrid workflow:
-
Stage 1: Exploration and Preparation (in QGIS). You start with your raw data files—shapefiles of administrative boundaries, CSV files of patient addresses, raster files of pollution data. You use the interactive QGIS environment to:
- Visually inspect the data to check for obvious errors.
- Perform straightforward geoprocessing tasks, like linking patient points to their corresponding census tracts (a spatial join).
- Clean the data and prepare it for analysis.
- Create some initial exploratory maps.
-
Stage 2: Analysis and Modeling (in R). Once the data is cleaned and structured, you export it from QGIS (often as a simple CSV or shapefile). Then you import this prepared data into R to:
- Perform statistical analysis (e.g., test for disease clustering). Since you are familiar with null hypotheses, you might use R to test the null hypothesis of complete spatial randomness.
- Build explanatory models (e.g., a regression model relating asthma rates to air pollution levels and socioeconomic status).
- Automate the creation of dozens of maps or charts.
- Package the entire analysis in a single, reproducible script.
This complementary use of tools is standard practice. An academic review of software for disease surveillance provides a more formal perspective on why different tools are suited for different tasks.
Review of software for space-time disease surveillance - PMC
This paper from the International Journal of Health Geographics reviews and compares several software packages for space-time disease surveillance, including both GUI tools and R.
Please read two sections from this paper: Skim the section on User Facility. Notice how GUI-based systems like ClusterSeer and SaTScan are praised for their help menus and ease of use, while the R package is noted to require familiarity with the language. Read the Conclusions section carefully. The authors explicitly state that different programs "serve different purposes." They recommend GUI tools for exploration and R-based packages for advanced modeling and automation, summarizing the core concept of our lesson.
The review concludes that GUI tools are excellent for "initial data exploration," while command-based systems like R are better for implementing complex models and creating automated, integrated workflows. This is the essence of the hybrid approach.
Conclusion
In this lesson, we have contrasted the two dominant paradigms for spatial analysis and shown how they work together to form a powerful and complete workflow.
- Key Takeaways:
- GUI software (QGIS) is your tool for interactive, visual tasks. Its strengths are ease of use and direct data exploration, making it ideal for initial data preparation and simple map-making.
- Programming environments (R) are your tools for robust, reproducible analysis. Their strengths are automation, scalability, and access to advanced statistical methods, which are essential for scientific research.
- A modern analyst does not choose between them but uses them in concert: QGIS for exploration and preparation, R for modeling and automation.
You are now fully equipped with the foundational concepts of spatial data and the tools used to analyze it. In the next module, we will put this knowledge into practice, starting with the "point-and-click" world. You will learn to navigate the QGIS interface, import data, and create your very first thematic health map.