Hello! Welcome to your seventh lesson in the "MLOps and Model Deployment" module.
In our last lesson, we took a monumental step: deploying a containerized application to the cloud using AWS ECS and Google Cloud Run. Your application now has a public URL and is, for all intents and purposes, live. But as MLOps engineers, our work doesn't end at deployment—it begins.
This lesson addresses the critical question: "Now that my model is running, how do I know it's still working correctly?" Our learning outcome is to monitor model performance metrics in production. We'll explore why models degrade over time and learn about the tools and techniques used in the industry to keep them healthy and effective.
1. Why Models Need a Health Check
Once a model is deployed, it's exposed to the complexities of the real world, which is often messier and more dynamic than the clean dataset it was trained on. Model performance almost inevitably degrades over time.
To understand why, let's explore two fundamental concepts.
[PDF] Deploying and Monitoring ML Models
The article 'Deploying and Monitoring ML Models' from Full Stack Deep Learning provides a concise explanation of why models degrade. We'll focus on the core reasons.
Please read the section titled '1 - Why Model Degrades Post-Deployment?' on page 10. It clearly defines the three main failure modes for a deployed model.
As the reading explains, the primary reasons for performance degradation are:
- Data Drift: The statistical properties of the input data change. For example, a loan prediction model trained before an economic downturn will see a very different distribution of applicant incomes and credit scores after the downturn begins.
- Concept Drift: The relationship between the input data and the target variable changes. For instance, in a recommendation system, user preferences (the "concept" of what makes a good recommendation) can change over time due to new trends or seasonal effects.
- Domain Shift (Upstream Data Changes): Often, this is a more abrupt change caused by issues in the data pipeline. A feature might be renamed, units might change (e.g., from meters to feet), or a bug might start producing
nullvalues.
Because of these "drifts," a model that was 95% accurate during testing can silently become much less accurate in production, leading to poor business outcomes. Monitoring is our system of alarms to detect these problems early.
2. What to Monitor: A Hierarchy of Signals
Now that we know why we need to monitor, let's figure out what to monitor. There's a trade-off between how informative a metric is and how easy it is to collect in real-time.
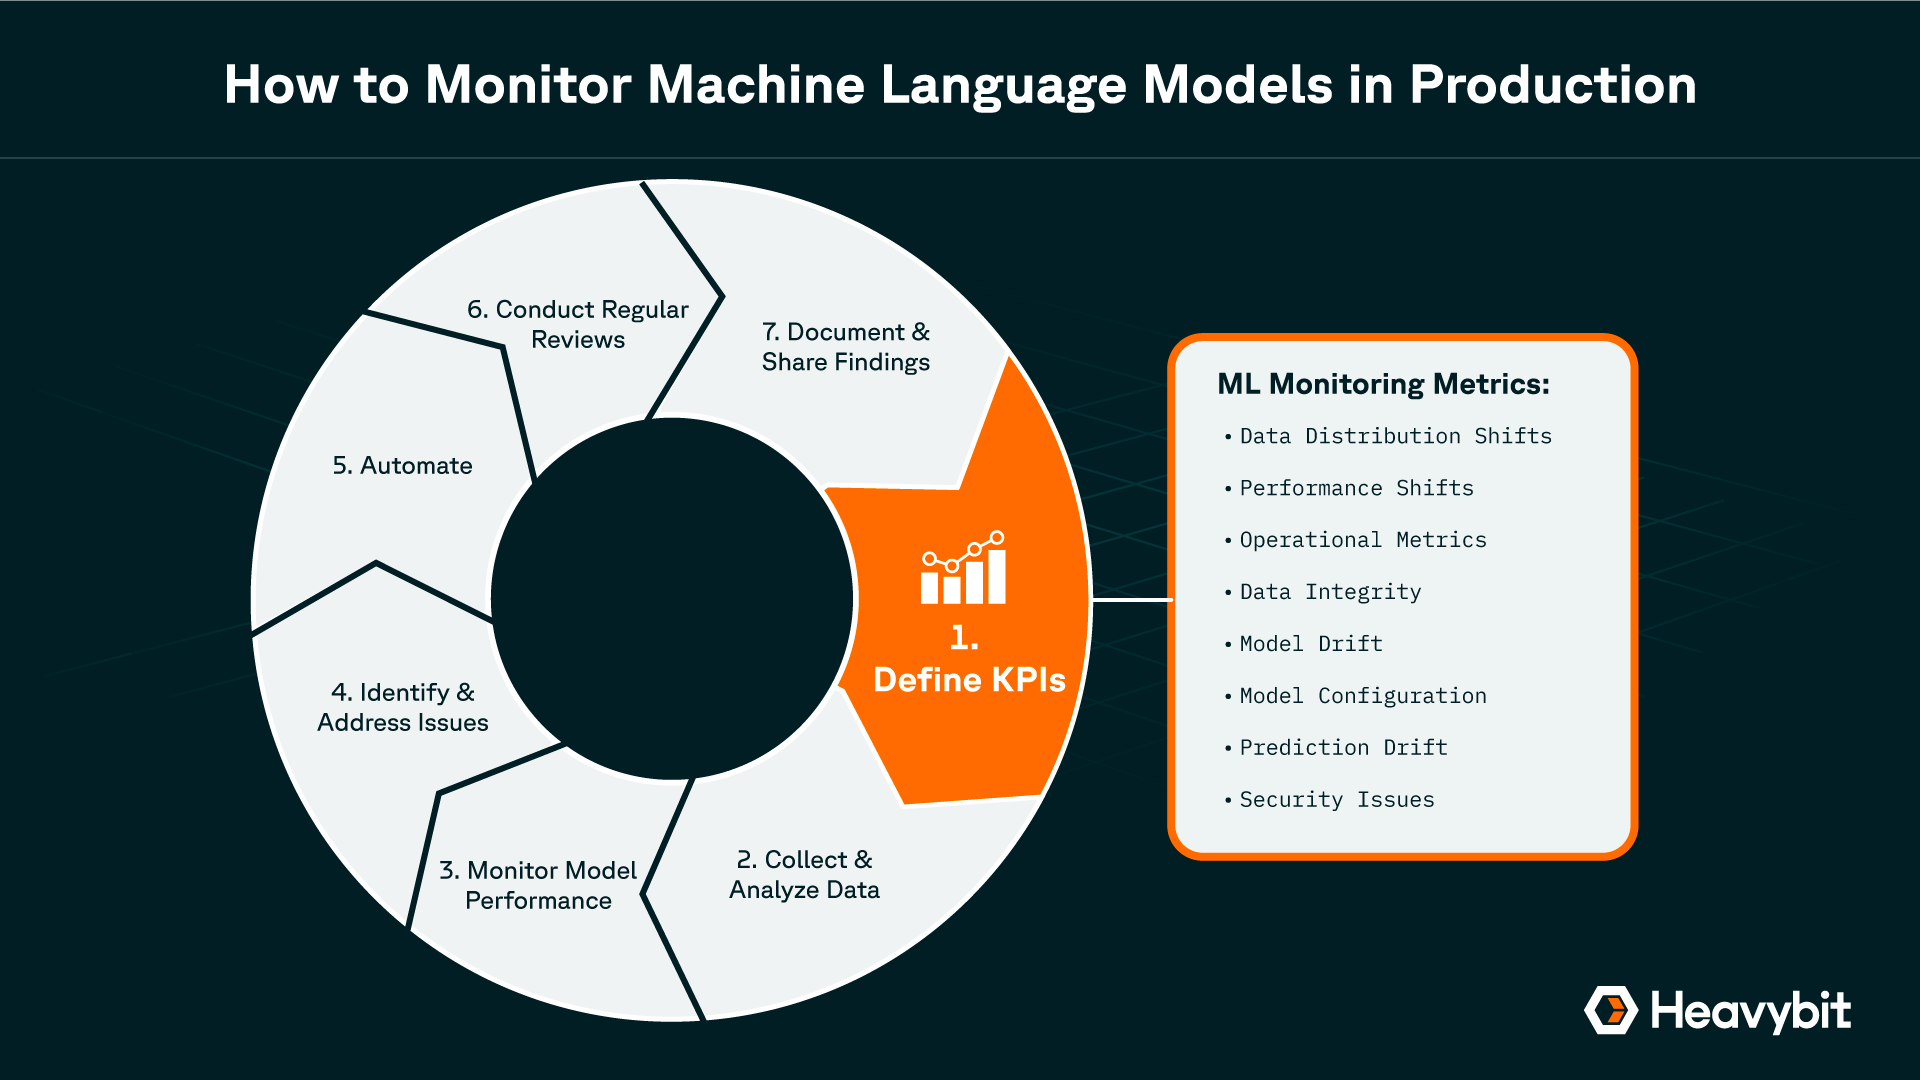
We can categorize the signals we monitor into two main groups: Functional (related to the model's logic) and Operational (related to the system's health). The Neptune AI blog post provides an excellent, detailed breakdown.
Monitor Your Models in Production: A Guide
The guide 'Monitor Your Models in Production' gives a comprehensive overview of the different facets of monitoring. We will use it as a reference throughout this lesson.
Skim through the sections on 'Functional monitoring' and 'Operational level monitoring'. You don't need to read every detail now, but get a feel for the two main categories. We will refer back to specific parts.
Here’s a summary of the key metrics, ordered from most informative (but often hardest to get) to easiest (but less direct):
-
Model Performance Metrics (Ground Truth):
- What: Direct measures of model quality like Accuracy, Precision, Recall, F1-Score (for classification) or MAE, RMSE (for regression).
- Challenge: Requires ground truth labels, which are often delayed or unavailable in real-time. (e.g., you only know if a loan defaulted months later).
- Covered in: The "Predictions (Output)" subsection of the Neptune article (LINK).
-
Model Inputs and Predictions (Proxy Metrics):
- What: The statistical distributions of your model's input features and its output predictions.
- Why: If the distribution of incoming data (e.g., average age of users) or predictions (e.g., the model suddenly predicts "fraud" 50% of the time instead of 1%) changes significantly from the training data, it's a strong indicator of drift. This is called prediction drift.
- Challenge: It tells you something is wrong, but not exactly what or how much your accuracy has dropped.
- Covered in: The "Data/feature drift" and "Scoring models when ground truth is NOT available" subsections of the Neptune article (LINK).
-
Operational / System Metrics:
- What: Standard application performance metrics like latency (how long a prediction takes), traffic (requests per second), error rate (e.g., HTTP 500 errors), and resource usage (CPU/Memory).
- Why: These are your first line of defense. A sudden spike in latency or errors could indicate a bug or infrastructure problem.
- Challenge: These metrics tell you if the system is running, but not if the model's predictions are correct.
- Covered in: The "Operational level monitoring" section of the Neptune article (LINK).
In practice, a robust monitoring strategy uses a combination of all three.
3. Practical Monitoring: Model & Data with Evidently AI
Let's start with functional monitoring. How can we track model performance, data drift, and prediction drift? Evidently AI is a fantastic open-source Python library designed specifically for this. It generates interactive reports comparing your current production data against a reference dataset (like your training or validation set).

The following video from Krish Naik provides a practical walkthrough of using Evidently AI to monitor a regression model.
Evidently AI Tutorial-Open Source ML Models Monitoring and Observability
This tutorial demonstrates how to use Evidently AI to generate performance reports and detect drift between a reference dataset and a 'current' (production) dataset.
Watch the following sections to understand the core workflow of Evidently AI: Setup and Baseline (Watch 5:29 - 11:07): See how the data is prepared and how an initial RegressionPreset report is generated on the reference data. Pay attention to the plots it creates, like 'Predicted vs Actual' and 'Error Distribution'. Detecting Degradation (Watch 14:23 - 20:04): This is the key part. The video simulates new 'week one' data and runs the report again, this time comparing the current_data to the reference_data. Notice how the report visualizes the drop in model quality and the changes in error distribution. Advanced Reports (Watch 20:04 - 25:38): This section shows how you can focus on specific issues by generating TargetDriftPreset and DataDriftPreset reports. This is how you would diagnose the root cause of the performance drop.
Evidently AI gives you the power to answer questions like:
- "Has my model's Mean Absolute Error increased in the last week?"
- "Is the distribution of the 'age' feature in production different from what my model was trained on?"
- "Are the predictions my model is making today different in distribution from last month?"
Answering "yes" to these questions is a strong signal that it's time to investigate and possibly retrain your model.
4. Practical Monitoring: System Health with Prometheus & Grafana
While Evidently is great for data and model-specific metrics, we also need to monitor the operational health of our application. For this, the industry-standard stack is Prometheus and Grafana.
- Prometheus: A time-series database that "scrapes" (pulls) metrics from an application's
/metricsendpoint. - Grafana: A visualization tool that queries Prometheus and builds beautiful, interactive dashboards.
Your Python background and full-stack goal make this particularly relevant. You need to know how to instrument your own application to make it monitorable.
Monitor Your Python Applications with Prometheus & Grafana
This NeuralNine video shows you how to instrument a Python Flask application to expose metrics, and then how to set up Prometheus and Grafana to monitor it. The concepts apply directly to FastAPI as well.
Follow this practical guide to understand the complete operational monitoring loop: Instrumenting the Python App (Watch 1:53 - 13:37): This is the most critical part for you as a developer. Focus on how the prometheus_client library is used to create different metric types: Counter for things like requests and exceptions, and Summary for tracking things like request latency or numerical inputs. Containerizing the Stack (Watch 13:37 - 20:51): This section shows how Docker Compose is used to run the Flask app, Prometheus, and Grafana as a cohesive system. This builds directly on our previous lessons on containerization. Pay attention to the prometheus.yml file, which tells Prometheus where to find your application. Building a Dashboard (Watch 21:33 - 30:45): See how Grafana is connected to Prometheus as a data source. Observe how you can build panels to visualize the metrics you exposed from your Python code, like total requests, exceptions over time, and even the average of numbers processed by an endpoint.
By instrumenting your application with prometheus_client, you can track vital operational metrics. If you see a spike in the app_exceptions_total counter or the app_request_latency_seconds summary, you know there's a system-level problem that needs immediate attention, independent of whether the model's predictions are still accurate.
Conclusion
You've now seen that deploying a model is just the first step. True MLOps involves continuously observing its behavior in the real world to ensure it remains reliable and valuable.
Key Takeaways:
- Models in production are not static; their performance degrades due to data drift and concept drift.
- We monitor at two levels: Functional Monitoring tracks model-specific metrics like prediction accuracy and data distributions, and Operational Monitoring tracks system health like latency and error rates.
- Evidently AI is a powerful open-source tool for functional monitoring, allowing you to compare production data against a reference set to detect performance degradation and drift.
- Prometheus and Grafana form the industry-standard stack for operational monitoring, where you instrument your application to expose metrics and build dashboards to visualize them.
Preview of the Next Lesson:
We've seen tools like Evidently AI detect "data drift," but how do they do it under the hood? In our next lesson, we will dive deeper and learn how to detect data drift using statistical methods. You'll learn about the statistical tests, like the Kolmogorov-Smirnov test and Population Stability Index (PSI), that power these monitoring platforms. This will connect the practical tools you've seen today with the underlying statistical theory.