Hello! In our last lesson, we explored the monotonic stack pattern and used it to efficiently solve the 'Next Greater Element' problem. You learned how traversing an array from right to left and maintaining a sorted stack could transform an O(n²) problem into a linear O(n) solution.
Today, we will apply that powerful pattern to a classic, and slightly more complex, problem: calculating the largest rectangle in a histogram. This is a common and challenging question in technical interviews, and mastering it will significantly deepen your understanding of how stacks can solve non-obvious problems. Following our established learning path, we will begin with intuitive but slower approaches before building up to the elegant and optimal single-pass monotonic stack solution.
1. Understanding the Problem
Imagine a bar chart where each bar has a width of 1 and a height given by an array of integers. Our goal is to find the area of the largest rectangle that can be inscribed within this histogram.
For example, given the heights [2, 1, 5, 6, 2, 3], the largest rectangle has a height of 5 and a width of 2 (it covers the bars of height 5 and 6), giving an area of 10.
To get a formal definition, please review the problem statement from the takeUforward guide.
Area of largest rectangle in Histogram - Tutorial
This article clearly defines the problem and provides a helpful example.
Read the problem statement and the example to ensure you understand the input and the desired output.
2. The Brute-Force Approach: O(n²)
As always, let's start with the most straightforward approach. The core idea of any solution will be to find, for every possible rectangle, its area (height * width) and keep track of the maximum.
A simple brute-force method is to consider every single bar as the potential shortest bar in a maximal rectangle. For each bar i with height h = heights[i], we can expand to its left and to its right as long as the bars we encounter are at least as tall as h. The distance between the left and right boundaries gives us the width.
Let's say we are at heights[i].
- We find the leftmost index
lsuch that all bars fromltoiare>= heights[i]. - We find the rightmost index
rsuch that all bars fromitorare>= heights[i]. - The width is
r - l + 1. - The area is
heights[i] * (r - l + 1).
Doing this for every bar i involves nested loops, leading to an O(n²) time complexity.
Largest Rectangular Area in a Histogram - GeeksforGeeks
This GeeksforGeeks article explains the O(n²) approach where you fix each bar and expand outwards.
Read the section titled "Naive Approach" and examine the Java code. Notice the nested loops that traverse left and right from a central bar i to find the boundaries of a possible rectangle. This establishes our baseline for performance.
While correct, this O(n²) solution is too slow for the constraints of a typical coding interview. We need a more efficient way to find the left and right boundaries for each bar.
3. A Better Approach: Pre-computation with Two Passes (O(n))
The bottleneck in the brute-force approach is re-calculating the left and right boundaries for each bar. What if we could pre-compute these boundaries for all bars in one go?
This is the key insight: for any given bar heights[i], the largest rectangle that can be formed with this bar as the minimum height is bounded by the first bar to its left that is shorter than it and the first bar to its right that is shorter than it.
This means we need to find two things for each index i:
- Previous Smaller Element (PSE): The index of the first bar to the left of
ithat is shorter thanheights[i]. - Next Smaller Element (NSE): The index of the first bar to the right of
ithat is shorter thanheights[i].
This should sound very familiar! In the last lesson, we used a monotonic stack to find the "Next Greater Element." The logic to find the NSE and PSE is almost identical—we just change the comparison from > to <.
So, the algorithm becomes:
- Create an array
previousSmallerand populate it by traversing the heights from left to right using a monotonic stack. This takes O(n). - Create an array
nextSmallerand populate it by traversing the heights from right to left using a monotonic stack. This also takes O(n). - Iterate through the
heightsarray one last time. For each indexi, calculate the width aswidth = nextSmaller[i] - previousSmaller[i] - 1. The area isheights[i] * width. Keep track of the maximum area found. This is our final O(n) pass.
The video from "take U forward" explains this intuition perfectly.
L12. Largest Rectangle in Histogram | Stack and Queue Playlist
Striver explains the core idea of using the Previous Smaller and Next Smaller elements to determine the width of the rectangle for each bar.
Watch from the start of the explanation of what is needed for each bar. Focus on the formula he derives: height * (next_smaller_index - previous_smaller_index - 1). This is the foundation of the optimal approach.
The image below shows the helper arrays and the formula for calculating the area for each bar.
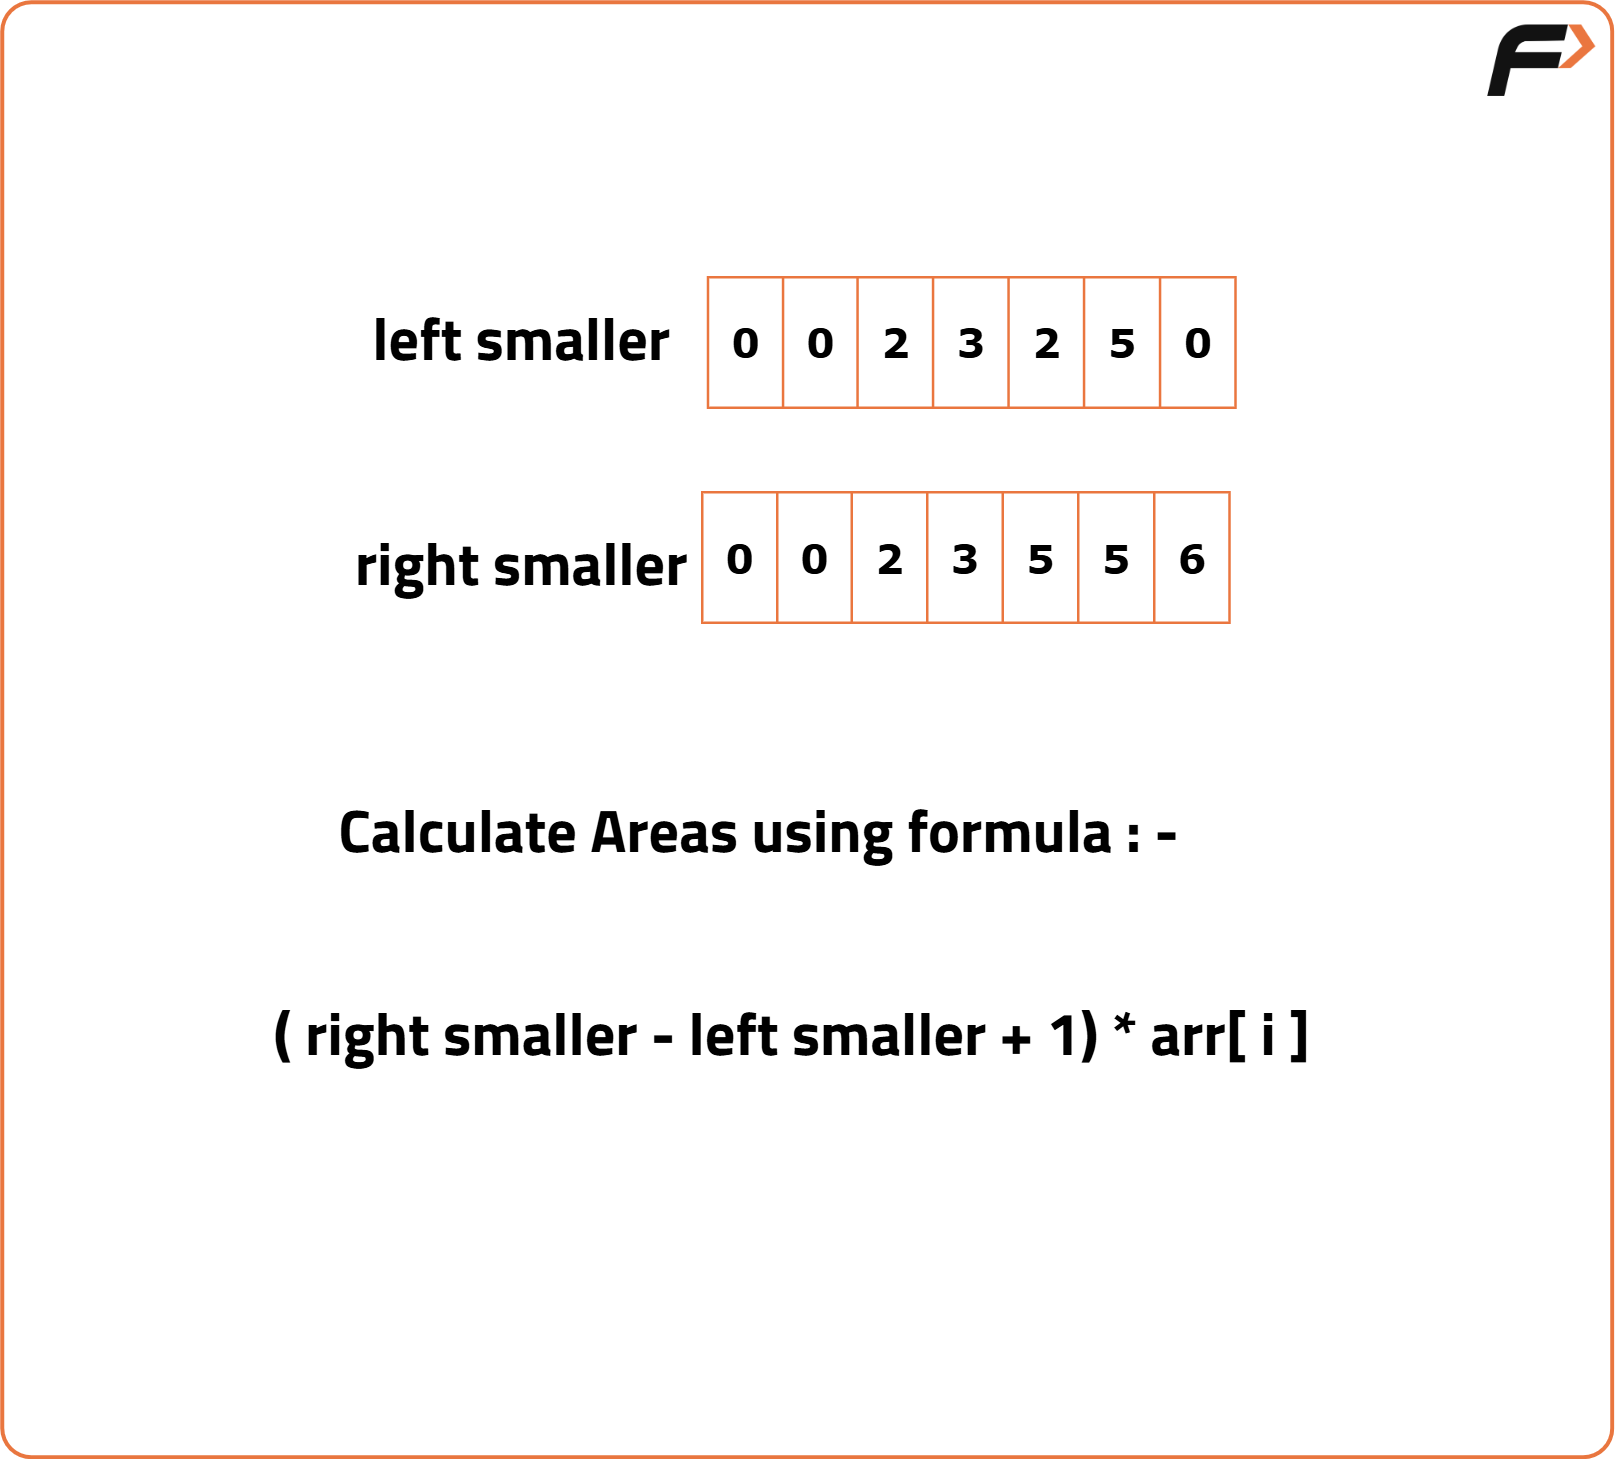
This two-pass approach is a massive improvement. It runs in O(n) time. However, it uses O(n) extra space for the two helper arrays and requires multiple passes over the data. The inevitable interview follow-up is: "Can you do it in a single pass?"
4. The Optimal Solution: A Single-Pass Monotonic Stack
The answer is yes. We can combine the logic of finding boundaries and calculating areas into a single left-to-right pass using just one monotonic stack.
Here, we will maintain a stack of indices of bars in monotonically increasing order of height.
The Algorithm:
- Initialize an empty stack (we'll use
Deque<Integer> stack = new ArrayDeque<>();) andmaxArea = 0. - Iterate through the
heightsarray from left to right, with an indexifrom0ton(inclusive, wherenis the array length). - Inside the loop, we have a
whilecondition: while the stack is not empty AND the current barheights[i]is smaller than the bar at the index on top of the stack (heights[stack.peek()]).- This is the critical moment. Finding a smaller bar
heights[i]means we've just found the Next Smaller Element (NSE) for the bar at the top of the stack. - So, we pop an index
h_idxfrom the stack. The height of our rectangle isheight = heights[h_idx]. - The right boundary for this rectangle is the current index,
i. - The left boundary is the index now at the top of the stack (
stack.peek()). If the stack becomes empty after popping, it means there was no smaller bar to the left, so the left boundary is effectively-1. - The width is
width = i - stack.peek() - 1. If the stack is empty,width = i. - Calculate
area = height * widthand updatemaxArea = Math.max(maxArea, area).
- This is the critical moment. Finding a smaller bar
- After the
whileloop finishes, push the current indexionto the stack. This maintains the increasing order. - The loop runs up to
i = nto handle any bars remaining in the stack. Wheni=n, we can imagine a bar of height 0, which ensures all remaining bars in the stack are processed.
This "pop-and-calculate" logic allows us to determine the boundaries and compute the area for a bar precisely when we find its right boundary (its NSE).
Let's watch a detailed dry-run of this algorithm. The intuition of "coming back" to calculate the area for an element once you find its right boundary is key.
L12. Largest Rectangle in Histogram | Stack and Queue Playlist
This is the core of the lesson. Striver first builds the intuition for a single pass and then performs a detailed dry run.
First, watch the segment on the intuition for a single pass. He explains that when you're traversing left-to-right, you know the "previous smaller" but not the "next smaller". The trick is to calculate the area for a bar only when you pop it from the stack. Then, watch the full dry run. Follow along as he pushes and pops indices from the stack, calculating the area for each popped element. This visualization is crucial for understanding how the boundaries are determined on the fly.
This infographic provides a concise visual summary of the entire single-pass algorithm.
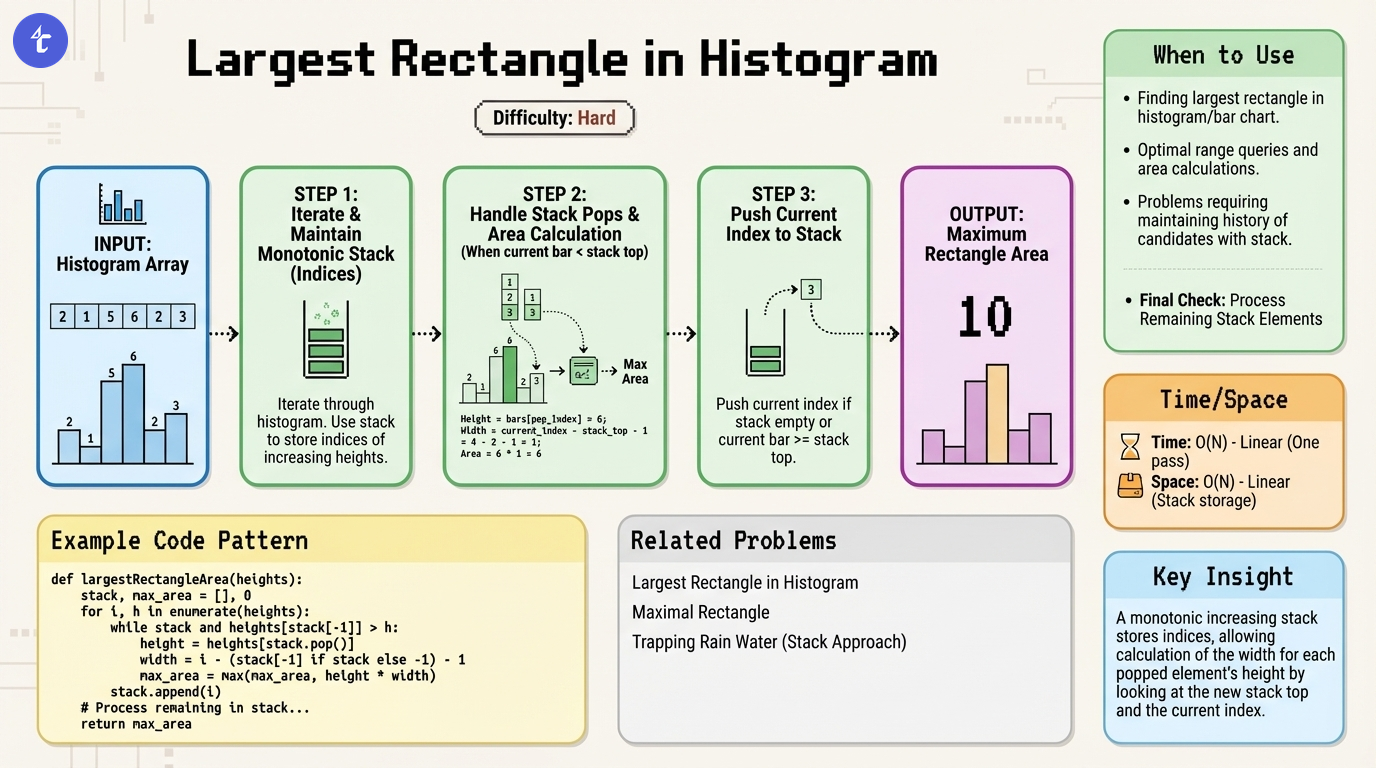
Finally, let's look at the clean Java implementation of this optimal approach.
Area of largest rectangle in Histogram - Tutorial
This section of the takeUforward article provides the complete Java code for the most optimized single-pass solution.
Read the code under "Optimised Approach 2". Compare this implementation with the algorithm and the dry run you just watched. Pay close attention to how the loop goes up to i <= n and how the width is calculated differently when the stack becomes empty.
Complexity Analysis:
- Time Complexity: O(n). Although there is a nested
whileloop, each bar's index is pushed onto the stack exactly once and popped from the stack at most once. This amortizes to a linear time complexity. - Space Complexity: O(n). In the worst-case scenario (an array sorted in increasing order), the stack could hold all
nindices.
Conclusion
In this lesson, you've tackled a challenging problem by applying and extending a pattern from our previous session. You saw how a problem about geometric areas can be cleverly transformed into a search for "smaller elements," a perfect job for a monotonic stack.
Key Takeaways:
- The area of the largest rectangle in a histogram can be found by considering each bar as the shortest bar in a potential rectangle.
- The boundaries of such a rectangle are defined by the Previous Smaller Element (PSE) and the Next Smaller Element (NSE).
- A brute-force
O(n^2)approach is too slow. A two-passO(n)solution that pre-computes PSE and NSE arrays is better but not optimal. - The most optimal solution uses a single pass and a monotonic increasing stack. It calculates a bar's maximum area at the moment it is popped from the stack, because that's when its right boundary (NSE) is found.
In our next lesson, we will solve another classic problem, 'Trapping Rainwater'. While it can also be solved with stacks, we will explore a more intuitive and optimal two-pointer approach, further expanding your problem-solving toolkit.