In our last lesson, we introduced the fundamental structure of the Cox proportional hazards model, , and established its semi-parametric nature. We saw that the model allows us to investigate the effects of multiple predictor variables on survival without making assumptions about the shape of the underlying hazard over time.
Now, we move from the model's structure to its practical application: interpreting its output. The core purpose of fitting a Cox model is to understand how different factors influence the hazard of an event. This is done by examining the model's coefficients () and, more importantly, their exponentiated form—the hazard ratio (HR). This lesson will equip you to translate the numbers from a Cox model's output into meaningful statements about risk.
From Coefficients to Interpretable Ratios
When a statistical software fits a Cox model, it estimates the coefficients, , for each covariate in the model. A positive coefficient suggests that the covariate increases the hazard, while a negative suggests it decreases the hazard.
However, the coefficient itself represents the log-hazard ratio, which is not very intuitive. To make sense of it, we take its exponential, , which gives us the Hazard Ratio (HR).
The video below provides a clear explanation of this transition from the less intuitive coefficient to the directly interpretable hazard ratio.
COX REGRESSION and HAZARD RATIOS - easily explained with an example!
The channel Biostatsquid has a great video that explains the role of coefficients and why we convert them into hazard ratios for interpretation.
Watch the segment from outputs of Cox regression. Focus on the distinction between the coefficient (\beta), which is on the log-hazard scale, and the hazard ratio (\exp(\beta)), which is a direct multiplier of the hazard.
The relationship is straightforward:
- If , then , indicating an increased hazard.
- If , then , indicating a decreased hazard.
- If , then , indicating no effect on the hazard.
The hazard ratio quantifies the multiplicative effect of a covariate on the hazard rate. For example:
- An HR of 1.5 means the covariate increases the hazard by 50%.
- An HR of 0.7 means the covariate decreases the hazard by 30% (since 1 - 0.7 = 0.3).
This interpretation is the key to understanding the results of any Cox model. Now, let's see how it applies to different types of variables.
Interpreting the Hazard Ratio for Categorical Covariates
Categorical covariates represent group membership, such as being in a treatment or control group, or being male or female. In a regression model, one category is always chosen as the reference level (typically coded as '0'). The hazard ratio for the other category (coded as '1') then represents the hazard of that group relative to the reference group.
Methods to Analyze Time-to-Event Data: The Cox ...
The paper "Methods to Analyze Time-to-Event Data" offers excellent, clear examples of how to interpret hazard ratios for different types of variables.
Read the paragraph that starts with the formula. Pay close attention to how the HR for a dichotomous risk factor is explained, and how it is converted into a percentage change in risk.
Let's solidify this with an example. Imagine a clinical trial testing a new drug against a placebo.
- Covariate:
treatment_group(coded as 0 for Placebo, 1 for Drug) - Fitted Model HR: 0.60
Interpretation:
The hazard ratio of 0.60 means that, at any point in time, a patient in the drug group has 0.60 times the hazard of death (or whatever event is being measured) compared to a patient in the placebo group, assuming all other factors are equal.
We can also express this as a percentage change:
So, we can say: "The new drug is associated with a 40% reduction in the hazard of death compared to the placebo."
Interpreting the Hazard Ratio for Continuous Covariates
For continuous covariates like age, blood pressure, or a feature adoption score, the interpretation is slightly different. The HR represents the change in hazard for a one-unit increase in the value of the covariate, holding all other variables constant.
The reading from the PMC article you just completed also provides clear examples for continuous variables. For instance, an HR of 1.03 for age (in years) implies that for each additional year of age, the hazard of the event increases by 3%.
It's crucial to be aware of the units. If the covariate was age_in_decades, an HR of 1.3 would mean a 30% increase in hazard for every 10-year increase in age.
Let's consider another example from a business context that might feel familiar from your data science interests.
Cox Proportional Hazards: Practical Guide for Data-Driven ...
The article from MCP Analytics provides a practical interpretation framework using a customer churn example, which is a classic survival analysis problem in business.
In the section "Reading the Coefficient Table," focus on the interpretation provided for the continuous covariates Age and Usage. Notice how the interpretation is framed around a one-unit change and can be scaled for larger changes (e.g., a 10-year difference in age).
Putting it All Together: A Multivariable Model
The real power of the Cox model comes from its ability to assess the impact of several variables at once. In a multivariable model, the HR for each covariate is its effect after adjusting for or controlling for the effects of all other variables in the model. This is analogous to interpreting coefficients in a multiple linear or logistic regression model.
Let's look at what a typical output table from a Cox regression analysis looks like.

Now, let's interpret a full example. The Biostatsquid video provides a walkthrough of a table with multiple variables.
COX REGRESSION and HAZARD RATIOS - easily explained with an example!
This segment of the video demonstrates how to interpret a full output table containing a mix of categorical and continuous predictors.
Watch the walkthrough of the clinical trial example from an example. Observe how the narrator interprets the HR for treatment (categorical), age (continuous), and gender (categorical), paying attention to statistical significance (p-value) and the confidence interval.
The image below gives a simple, colorful summary of how to interpret the direction of the effect based on the hazard ratio.
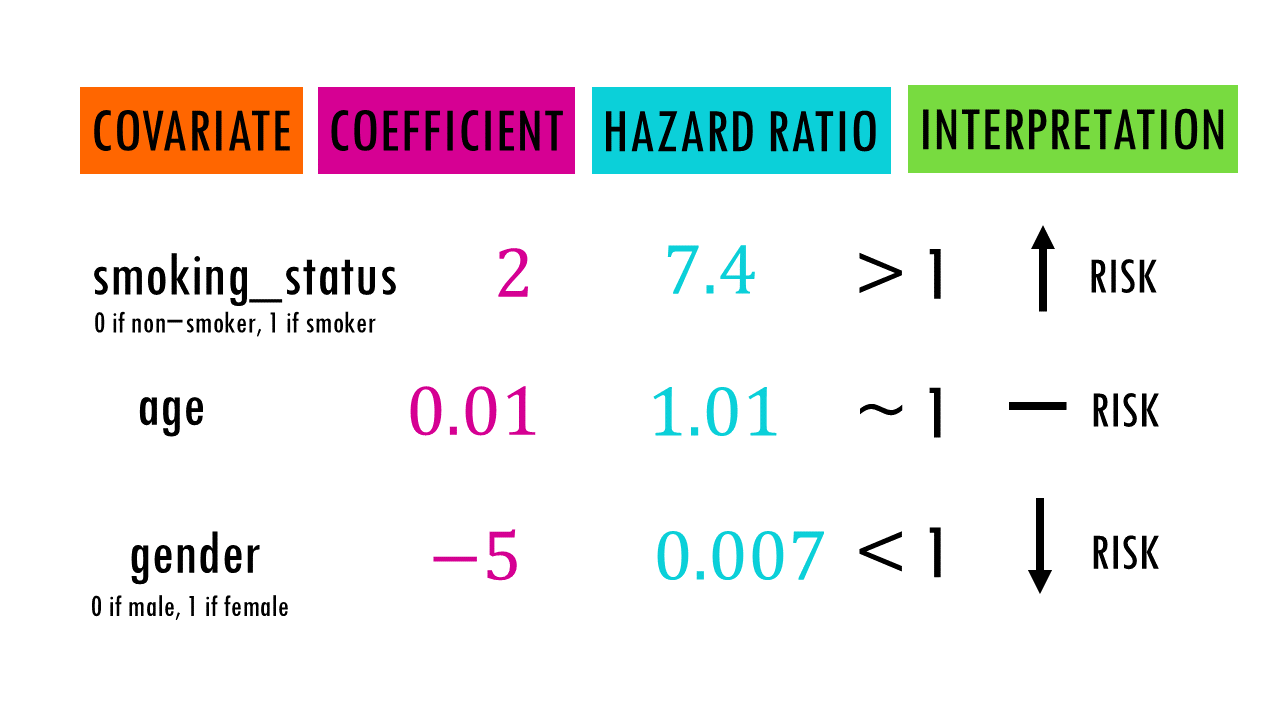
Let's consider one final, more detailed example from the MCP Analytics article, which examines SaaS customer churn. This illustrates how Cox regression can uncover "hidden patterns" by controlling for confounders, a concept highly relevant in machine learning feature analysis.
Cox Proportional Hazards: Practical Guide for Data-Driven ...
This section presents a complete, real-world example of using Cox regression to understand customer retention, from data preparation to strategic decisions.
Read the section "Real-World Example: SaaS Customer Retention." Focus on the Cox Model Results table and the interpretation under "Hidden Patterns Uncovered." Notice how the effect of Acquisition Channel disappears after controlling for other factors like Pricing Tier and Onboarding, demonstrating the power of multivariable adjustment.
Conclusion
In this lesson, we focused on the practical interpretation of the most important output from a Cox model: the hazard ratio. You now have the tools to translate these statistical estimates into clear, actionable insights about risk.
Here are the key takeaways:
- The hazard ratio (HR) is the exponentiated coefficient () and represents a multiplicative effect on the hazard rate.
- HR > 1 implies an increased risk, HR < 1 implies a decreased risk, and HR = 1 implies no effect.
- For categorical variables, the HR compares the hazard of one group to a designated reference group.
- For continuous variables, the HR represents the change in hazard for a one-unit increase in the variable's value.
- In a multivariable model, each HR is an adjusted estimate, reflecting the effect of one variable while holding all others in the model constant.
We have now covered what the Cox model is and how to interpret its main results. However, the validity of these interpretations hinges on a critical assumption: the proportional hazards assumption. In our next lesson, we will dive into what this assumption means and explore methods to check whether it holds true for our data.