Introduction
In our last lesson, we established the critical difference between best-estimate, prudent, and optimistic assumptions, defining them by their purpose and the presence of a Margin for Adverse Deviation (MAD). Now, we pivot from the 'what' to the 'how'. How do actuaries actually derive the numerical values for these assumptions? The answer, unsurprisingly, lies in data.
This lesson explores the landscape of data sources available to an actuary. We will categorize these sources, from a company's own internal records to broad national statistics, and evaluate the strengths and weaknesses of each. By the end of our session, you will be able to describe the main sources of data for setting assumptions and understand the fundamental trade-off between the relevance of data and its statistical credibility—a core challenge in actuarial practice. This forms the essential groundwork for our upcoming lessons on setting specific assumptions like mortality and expenses.
The Hierarchy of Data Sources
An actuary rarely relies on a single source of data. Instead, they draw from a variety of sources, weighing and blending them to arrive at the most suitable basis. We can think of these sources as forming a hierarchy, from the most specific and relevant to the most general and credible.
A comprehensive report by PartnerRe, a major reinsurance company, provides an excellent overview of the data sources used to determine a "Best Estimate." We will use this as our guide.
[PDF] Setting Best Estimate Assumptions for Biometric Risk | PartnerRe
This document provides a detailed, professional-grade walkthrough of the data sources available for setting actuarial assumptions. It forms the core of today's lesson.
Please read the chapter on "Data Sources". Start at the beginning of the chapter with the section on Data quality, which introduces the key criteria of appropriateness, completeness, and accuracy. Then, proceed to read the descriptions for each of the following data sources: Own/specific portfolio data Insured lives aggregated data Population level data Published tables Reinsurance pricing data Public reporting As you read, focus on the pros and cons of each source, particularly the tension between how representative the data is versus its statistical volume.
Let's synthesize what you've just read and build a clear framework.
1. Own/Specific Portfolio Data
This is an insurer's internal data on its own policyholders.
- Pros: It is the most appropriate or relevant source. It perfectly reflects the company's unique mix of business, including its distribution channels (e.g., brokers, direct sales), underwriting standards, and the socio-economic profile of its customers.
- Cons: The primary challenge is credibility. For a small company or a new product, the volume of data may be too low to be statistically significant. Random fluctuations can easily distort the underlying patterns. Collecting, cleaning, and storing high-quality internal data is also a significant operational expense.
2. Insured Lives Aggregated Data (Industry Data)
This consists of data pooled from multiple insurance companies, often managed by a professional body (like the UK's Continuous Mortality Investigation Bureau), a consulting firm, or a reinsurer.
- Pros: It offers a great balance. The data is still highly relevant as it comes from an insured population, but the volume is much larger, providing greater credibility than a single company's data.
- Cons: The key issue is heterogeneity. The "industry average" may not perfectly match your company's specific experience. For example, if your company targets a wealthier demographic than the industry average, its mortality experience might be lighter.
The following resource provides a useful mnemonic for remembering the potential problems with industry data.
CP1 Acronyms Part 5-8 Flashcards by annie clarissa - Brainscape
This flashcard deck is a useful tool for exam revision. We'll use it to summarize the potential drawbacks of using industry-level data.
Please review the card titled Problems with industry data. The mnemonic "DR DONEQ" can help you recall these points.
3. Population Level Data
This is data collected on the entire population of a country or region by government bodies like national statistics offices (e.g., ONS in the UK) or international organizations like the World Health Organization (WHO).
- Pros: This data has the highest statistical credibility due to its enormous size. It is often publicly available and well-documented.
- Cons: The main drawback is a lack of appropriateness. The general population is very different from the group of people who choose to buy insurance. This phenomenon, known as self-selection or anti-selection, means that population data may not be representative of the risks an insurer is covering. For example, people in poor health may be more likely to buy life insurance, leading to higher mortality for the insurer than in the general population.
Ancillary and Derived Data Sources
Beyond these primary sources, actuaries use several others that are often derived from or supplement the main three.
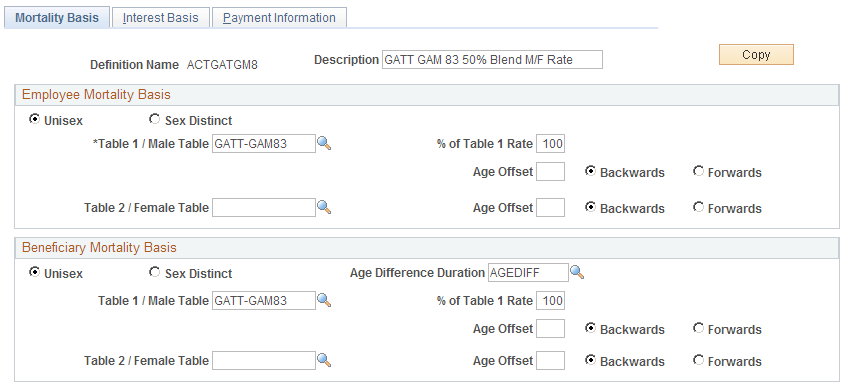
- Published Tables: These are standardized tables of rates (e.g., mortality rates by age and gender) published by regulatory or professional bodies. They are often based on population or industry data and serve as a common benchmark for the industry. A key consideration is that they may already include margins for prudence or may be out of date. The image below shows a screen from an actuarial system where a user is selecting a standard mortality table, "GATT-GAM83", as the basis for a calculation.
- Reinsurance Pricing Data: When an insurer seeks reinsurance, the quotes it receives from reinsurers contain an implicit assumption about the underlying risk. By analyzing these quotes, the insurer can gain insight into the reinsurers' best estimates and margins, providing a valuable external benchmark.
A Practical Example: Blending Data Sources
In practice, an actuary synthesizes information from multiple sources. A common technique involves using a broad, credible data source as a benchmark and then adjusting it based on the company's own, more relevant, experience.
The credibility of the company's own experience determines how much weight it is given in the final assumption. This directly applies credibility theory, which you will be familiar with from your statistical studies.
Let's examine a case study from the PartnerRe report that illustrates this process for setting a mortality assumption for a French group life insurer.
[PDF] Setting Best Estimate Assumptions for Biometric Risk | PartnerRe
This case study provides a concrete example of how the different data sources are combined in practice.
Please read the "Case Study 1: Mortality in France". Pay close attention to the following steps in their process: Setting the benchmark: Notice how they use French national statistics (population data) to create a benchmark, adjusting it for factors like occupational category. Calculating the A/E ratio: They calculate the "Actual to Expected" (A/E) ratio by comparing their own portfolio's claims (Actual) to what the benchmark predicted (Expected). Assessing Credibility: They calculate a credibility factor based on the volume of their own claims data. Blending the data: Finally, they create their Best Estimate by taking a weighted average of their own experience (the A/E ratio) and the benchmark (which is 100%), with the weights determined by the credibility factor.
This case study demonstrates the core actuarial skill of blending data: using a robust external benchmark as a starting point and then applying statistical methods to incorporate the unique, but less voluminous, experience of the specific portfolio being analyzed.
Data Sources in Other Contexts
The principles we've discussed are universal across all actuarial fields, not just life insurance. To see this in action, let's look at how assumptions are set in healthcare.
How Do Actuaries Model Healthcare Costs?
This video from 'AHealthcareZ - Healthcare Finance Explained' details the process of modeling healthcare costs, providing a practical application of our concepts in a different domain.
Please watch the following two clips: First, watch from this section on adjustments. The speaker explains how actuaries adjust for changes in plan design (like deductibles). Notice the explicit mention of using proprietary actuarial tables and benchmarking historical data to quantify the impact of these changes. This highlights the use of industry and derived data. Next, watch from the final comparison. The speaker discusses the final steps, which include adding a risk margin and, crucially, benchmarking the final result against similar groups using the actuary's extensive historical data sets.
As you can see, the process is analogous. Actuaries start with historical claims (own data), apply trends, and then use external benchmarks and proprietary tables (industry/derived data) to adjust for specific features and validate their results.
Conclusion
We have established that setting actuarial assumptions is a data-driven process that involves a careful balancing act. The ideal data would be both perfectly relevant to the specific risk being assessed and voluminous enough to be statistically credible. Since this is rarely the case, actuaries must skillfully blend different sources of data. The hierarchy runs from a company's own portfolio data (most relevant, often least credible) through aggregated industry data, to broad population statistics (least relevant, most credible). These are supplemented by derived sources like published tables and indirect sources like reinsurance pricing.
The key takeaway is that an actuary's final assumption is not based on a single data point but is a synthesized estimate, often derived by using a credible external source as a benchmark and adjusting it based on the company's own experience, with the degree of adjustment determined by credibility theory.
In our next lesson, we will apply these principles directly as we learn how to derive specific assumptions for mortality and morbidity, incorporating factors like future trends.
Key Takeaways & Cheatsheet
Here is a summary of the data sources, organized using the "TRAINERS" mnemonic, a popular revision aid.
| Mnemonic | Source | Description | Pros | Cons |
|---|---|---|---|---|
| T | Tables | Standardized tables published by professional bodies or regulators. | Easy to use, good benchmark. | May be out-of-date, may contain hidden margins. |
| R | Reinsurers | Data and pricing information from reinsurance companies. | Reflects market pricing, based on large datasets. | Assumptions are proprietary, premiums include margins. |
| A | Abroad | National/international statistics from other countries. | Useful for markets with little data, shows global trends. | May not be relevant to the local context. |
| I | Industry | Data pooled from multiple insurers. | Credible volume, reflects insured population. | Heterogeneous, may not match your company's niche. |
| N | National stats | Data on the general population from government bodies. | Very high credibility, publicly available. | Not representative of the insured population (anti-selection). |
| E | Experience | The company's own internal data. | Most relevant and appropriate source. | Often lacks sufficient volume for full credibility. |
| R | Reports | Publicly available company reports and regulatory filings. | Provides insight into competitors' reserving bases. | Often prudent, lacks detail and transparency. |
| S | Similar contracts | Data from other, similar products within the company. | Useful for new products with no direct history. | Differences in product features may affect experience. |