Introduction
In our previous lesson, we established a structured approach to identifying and classifying the universe of risks an organization faces, answering the question, "What are the risks?" Now, we move to the next logical step in the Enterprise Risk Management (ERM) process: risk assessment and measurement. This lesson will equip you to answer the critical follow-up question: "How big are these risks?"
We will tackle this by exploring the two fundamental approaches to risk assessment, which are central to your CP1 exam syllabus: qualitative and quantitative methods. We will first establish the core differences between these two philosophies. Then, we will delve into the specific techniques used within each approach, from subjective risk matrices to sophisticated statistical models. Given your strong background in statistics and probability theory, you will find that many quantitative concepts, such as Value at Risk, build directly on principles you are already familiar with, allowing us to focus on their practical application in an actuarial context.
The Fundamental Divide: Qualitative vs. Quantitative Analysis
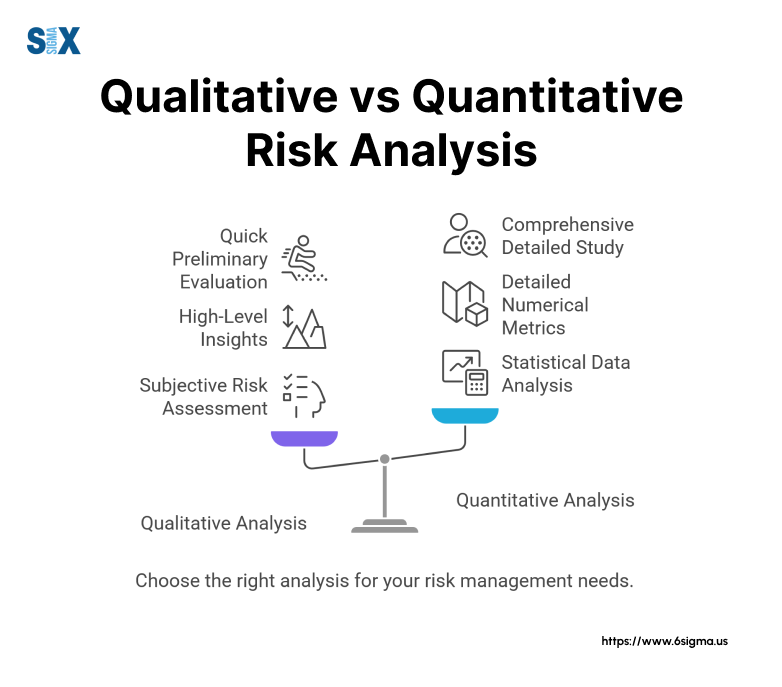
Before we examine specific tools, it's crucial to understand the distinction between qualitative and quantitative risk analysis. They are not mutually exclusive; rather, they serve different purposes at different stages of the risk management cycle. Qualitative analysis is typically a first pass, applied broadly, while quantitative analysis is a deeper dive, applied selectively.
This infographic provides a concise visual summary of the trade-offs.
To solidify this distinction, let's watch a short video that explains the role of each.
Qualitative versus Quantitative Risk Analysis
This video by David McLachlan clearly explains the purpose and process of both qualitative and quantitative risk analysis in a project management context, but the principles are identical for ERM.
Please watch the following segments: Qualitative Analysis: Note how it uses subjective ratings for probability and impact to prioritize risks. Crucially, the speaker mentions that all identified risks go through this process. Quantitative Analysis: Observe that this is applied only to selected risks and involves assigning numerical, often monetary, values. The mention of Monte Carlo simulations is a key example of a quantitative technique. Summary: This provides a quick recap of the core differences.
In essence, qualitative analysis helps us sort the "big" rocks from the "small" ones so we know where to focus our limited analytical resources. Quantitative analysis then tells us exactly how heavy those big rocks are.
Qualitative Assessment: Ranking and Prioritizing
The primary goal of qualitative assessment is to rank risks to determine which ones warrant immediate attention, further analysis, or specific mitigation actions. This process relies on expert judgment and descriptive scales rather than precise numerical calculations.
The Risk Matrix (Heat Map)
The most common tool for qualitative assessment is the risk matrix, also known as a heat map. This tool plots risks on a two-dimensional grid based on their assessed likelihood (or frequency) and impact (or severity).
- Likelihood: The chance of the risk event occurring. This is often rated on a scale, for example: 1 (Rare), 2 (Unlikely), 3 (Possible), 4 (Likely), 5 (Almost Certain).
- Impact: The magnitude of the consequences if the event occurs. This is also rated on a scale, often tied to financial, reputational, or operational metrics: 1 (Insignificant), 2 (Minor), 3 (Moderate), 4 (Major), 5 (Catastrophic).
A risk's overall score or rating is often the product of these two numbers (Likelihood × Impact). The results are then visualized in a color-coded grid (e.g., green, yellow, red) to immediately draw attention to the most critical risks in the top-right corner (high-likelihood, high-impact). This visual ranking is a key part of "Risk Prioritization" as described in actuarial literature.
Overview of Enterprise Risk Management
This document from the Casualty Actuarial Society describes the process of risk prioritization and the use of risk mapping.
Please read the section on Risk Prioritization. This text formally defines risk mapping and the two-dimensional grid we have just discussed.
Scenario Analysis
Another powerful technique, which bridges the gap between qualitative and quantitative assessment, is scenario analysis. While it can generate a financial number, its primary strength often lies in forcing management to think through the narrative of a plausible adverse event.
[PDF] Subject CP1 - CMP Upgrade 2021/22 - Actuarial Education
This excerpt from the ActEd study material explains how scenario analysis is used in practice, particularly for risks that are difficult to model stochastically.
Please read the section on Scenario analysis. Pay close attention to two key points: It is described as a deterministic method useful for risks where fitting probability distributions is difficult (like operational or emerging risks). The process quantifies the severity of the scenario but not its probability. The probability is often left as a qualitative judgment (e.g., "plausible").
Because the probability is not rigorously calculated, scenario analysis is often considered semi-quantitative and is a vital tool for assessing complex, low-frequency, high-severity risks like a global pandemic or a major cyber-attack.
Quantitative Measurement: "What is the Dollar Value of the Risk?"
Quantitative analysis aims to assign a numerical value to risk, typically in terms of a probability distribution of potential losses. This allows for a more objective comparison of risks and provides the necessary inputs for calculating economic capital.
The overall landscape of risk assessment methods, showing how qualitative and quantitative techniques fit together, is well-summarized in the following diagram.

Key Risk Measures
From your statistics background, you are familiar with describing a distribution by its moments (mean, variance, etc.). In risk management, we are particularly interested in specific characteristics of the loss distribution. The CAS paper provides an excellent summary of these measures.
Overview of Enterprise Risk Management
This section of the CAS paper provides clear, standard definitions for the most important quantitative risk measures.
Please read the descriptions under the heading Risk Measures. Focus on understanding the conceptual difference between the two categories: Solvency-related measures: These focus on the adverse "tail" of the loss distribution. Pay particular attention to the definitions of Value at Risk (VaR) and Tail Value at Risk (Tail VaR). Performance-related measures: These focus on volatility around the expected result. You will recognize Variance and Standard Deviation from your statistics work. Note the definition of semi-variance, which only considers unfavorable deviations.
Let's expand on the two most important solvency measures:
- Value at Risk (VaR): VaR is a quantile of the loss distribution. A 99.5% one-year VaR of $100 million means there is a 0.5% chance of losing more than $100 million over the next year. It answers the question: "How bad can things get?" up to a certain confidence level.
- Tail Value at Risk (TVaR): Also known as Expected Shortfall (ES), TVaR answers a different question: "If things do get bad, what is our expected loss?" It is the conditional expectation of loss, given that the loss exceeds the VaR threshold. It is considered a more coherent risk measure than VaR because it gives a better sense of the severity of extreme tail events, rather than just the point at which the tail begins.
The following video provides an excellent, clear explanation of VaR and also introduces another key quantitative technique: Stress Testing.
VaR and Stress Tests - Financial Markets by Yale University #4
Professor Robert Shiller of Yale University discusses Value at Risk and Stress Tests, providing both definitions and critical context.
Please watch the following segments: Value at Risk (VaR): Note the clear definition and the example given: "a 1% one-year value at risk of 10 million". Stress Tests: This explains the concept of a stress test, which is essentially a more extreme form of scenario analysis. It's not a statistical concept but a method of assessing vulnerability to a specific, severe shock (e.g., a financial crisis). Limitations of Stress Tests: This is a crucial segment for CP1. It highlights the risk that models and scenarios may fail to imagine truly extreme events, as illustrated by the story of the Freddie Mac stress test before the 2008 crisis. This demonstrates the problem of "unknown unknowns".
Application to Different Risk Types
These quantitative and qualitative methods are not equally applicable to all types of risk from our taxonomy.
- Market and Credit Risk: These are the most readily quantifiable risks. We have abundant historical data for interest rates, equity prices, and credit defaults. Techniques like VaR, TVaR, and stress testing are standard practice.
- Insurance Risk: This is the traditional domain of actuaries. Claims frequency and severity are modeled stochastically, allowing for the calculation of the full loss distribution and associated risk measures.
- Operational Risk: This is the most difficult to quantify. As the ActEd text explains, historical data on major operational failures (e.g., large-scale fraud, system collapse) is sparse. Therefore, assessment often relies on qualitative methods like scenario analysis or simplified "broadbrush" quantitative approaches.
[PDF] Subject CP1 - CMP Upgrade 2021/22 - Actuarial Education
This material highlights the unique challenges of measuring operational risk and how regulators handle it.
First, read the section on Operational risk. This confirms that operational risk events are often rare, making them hard to model statistically. Next, read about the Basel Accords' approach under Pillar 1, which prescribes minimum capital for operational risk. Notice that this is often a factor-based approach, not a sophisticated stochastic model: read this paragraph. This demonstrates a practical, albeit less precise, method of quantification.
Conclusion
In this lesson, we have addressed the critical task of moving from a list of identified risks to a meaningful assessment of their potential impact. We established the fundamental distinction between qualitative analysis—a broad, subjective process for prioritizing all risks—and quantitative analysis—a selective, data-driven process for measuring key risks in numerical terms.
Qualitative tools like the risk matrix help us rank risks by likelihood and impact, while scenario analysis allows us to explore the consequences of plausible adverse events. Quantitative methods, leveraging your background in probability theory, provide specific measures of risk. We focused on Value at Risk (VaR), which measures the maximum loss at a given confidence level, and Tail Value at Risk (TVaR), which measures the expected loss in the tail. We also discussed stress testing as a vital tool for exploring extreme vulnerabilities.
Finally, we saw that the choice of method depends on the risk itself, with market and credit risks being highly quantifiable, while operational risk often relies on more qualitative assessments.
In our next lesson, we will build on this foundation. Having measured individual risks, we must consider how they relate to one another. We will explore the concepts of risk correlation and interaction, which are essential for understanding the aggregate risk profile of an entire enterprise.
Key Takeaways & Cheatsheet
Here is a summary framework comparing the two approaches to risk assessment.
| Aspect | Qualitative Assessment | Quantitative Measurement |
|---|---|---|
| Purpose | Prioritize risks for further action; initial screening. | Calculate capital requirements; detailed risk-return analysis. |
| Scope | Applied to all identified risks. | Applied to a selection of key, material risks. |
| Nature | Subjective, based on judgment and experience. | Objective, based on data and mathematical models. |
| Output | Descriptive ratings (e.g., High, Medium, Low) or rankings. | Numerical values (e.g., $, %, probability distributions). |
| Key Techniques | • Risk Matrix (Heat Map) • Risk Ranking • Scenario Analysis (for narrative) |
• VaR & TVaR • Stress Testing • Stochastic Modelling (Monte Carlo) |
| Typical Application | Operational Risk, Strategic Risk, Reputational Risk. | Market Risk, Credit Risk, Insurance Risk. |
| Key Question Answered | "Which risks should I worry about most?" | "How much could we lose and how much capital do we need?" |