Hello! Welcome to the next lesson in our "Applying AI Builder Models" module.
In our previous lessons, you successfully trained both a form processing model and an object detection model. After training, you saw that AI Builder provides a performance score. While we briefly used the "Quick Test" feature to see the model in action, we didn't explore what these performance metrics truly mean or, more importantly, how to act on them.
Today's lesson addresses that gap. Your learning outcome is to evaluate and improve AI model performance using test data and performance metrics. This is a critical skill for a Power Platform developer. Building a model is just the first step; ensuring it is accurate, reliable, and production-ready is what distinguishes a professional solution. We will dissect the performance reports and explore a systematic, iterative process for refining your models—a workflow very similar to debugging and optimizing code.
1. Understanding AI Model Performance Metrics
After AI Builder trains a model, it automatically sets aside a portion of your data as a "test set." It then uses this unseen data to evaluate the model's performance, presenting the results through several key metrics.
Performance Grades
The most immediate feedback you get is a performance grade: A, B, C, or D. This grade provides a quick assessment of your model's quality.
Prediction model performance - AI Builder
The Microsoft Learn article 'Prediction model performance' explains this grading system in detail. It's important to understand that these grades are not absolute but are relative to your data.
Please read the sections 'Performance grade' and 'Accuracy range varies depending on your data'. Pay close attention to how the accuracy percentage required for an 'A' grade changes based on the distribution of your historical data. Also, note the R-squared ranges for numerical prediction models.
As you read, you'll see that a 92% accuracy score could be an 'A' grade for a problem with a 50/50 split but only a 'B' grade for a problem with an 80/20 split. This is because the model's improvement over a random guess is much greater in the first case. This nuance is key to a professional evaluation.
A 'D' grade is a significant warning sign. It indicates either:
- Underfitting: The model performs worse than a random guess. It hasn't learned the patterns in your data.
- Overfitting: The model performs perfectly or near-perfectly (e.g., >99%). This is a classic machine learning problem. It often means the model has "memorized" the training data, including its noise and idiosyncrasies, and will likely fail when it encounters new, real-world data. A common cause is including a data column that directly gives away the answer (e.g., predicting if a loan is 'Paid' when your data includes an 'IsPaid' column).
Core Performance Scores
Beyond the letter grade, AI Builder provides specific scores.
- Accuracy Score: Used for models that classify or identify things (e.g., prediction, object detection, category classification). It's the percentage of correct predictions made on the test dataset.
- R-squared: Used for models that predict a number (e.g., estimating the price of a house). This statistical measure indicates the "goodness of fit." A value of 85% means that 85% of the variation in the output values is explained by the model's inputs. A higher R-squared value generally indicates a better fit.
- Confidence Score: This is not a model-wide metric but a score assigned to each individual prediction the model makes at runtime. For example, when a form processing model extracts an invoice number, it will also return a confidence score (e.g., 98%) indicating how certain it is about that specific extraction. Low confidence scores on published models are a strong signal that you need to go back and retrain with more examples.
2. How to Evaluate a Model in Practice
Let's move from theory to practice. When you open a trained model in AI Builder, you're presented with a details page that is your primary tool for evaluation. We will use a Form Processing model as an example because its evaluation screen is particularly detailed, but the principles apply across all model types.
Improve the performance of your document processing model
The article 'Improve the performance of your document processing model' provides a clear, step-by-step guide on how to navigate to the evaluation screen and interpret what you find there.
Read the section 'Interpret your model accuracy score' to understand the process of opening a model and accessing the 'review full evaluation' panel.
Once you're in the evaluation panel, you can drill down from the overall score to see how the model performs on individual fields, tables, or collections.
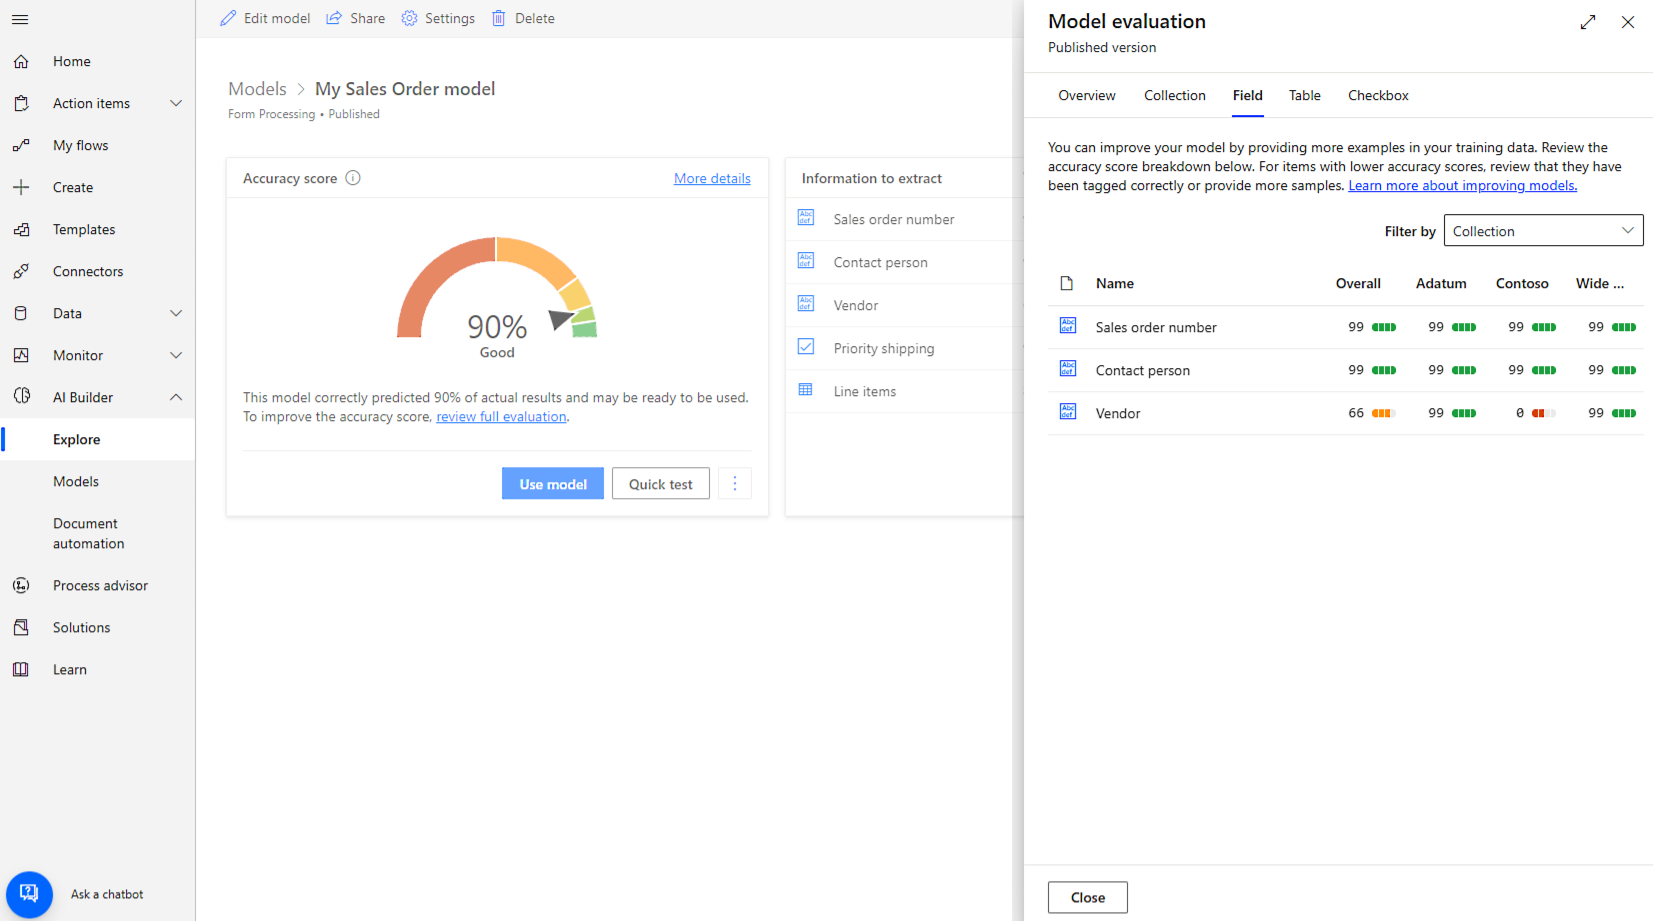
This detailed view is where your analysis begins. An overall score of 90% might look good, but it could be hiding a critical field that is only being extracted correctly 50% of the time.

This screen is your starting point for debugging. By identifying the specific fields, tables, or collections with low scores, you can focus your improvement efforts where they are needed most.
3. A Developer's Guide to Improving Model Performance
Once you've evaluated your model and identified its weaknesses, the next step is to improve it. This is an iterative process: you'll apply a change, retrain the model, and evaluate it again. Drawing from your background, you can think of this as a "debug, fix, recompile, and test" cycle.
Here are the most effective strategies you can use.
1. Provide More (and More Varied) Data
This is the single most effective way to improve most models. The model needs to see enough examples to learn the patterns reliably.
- Quantity: Aim for well over the minimum requirement. If the minimum is 15 images per object, try for 50+. If it's 50 rows of data, aim for 1,000+.
- Variety: This is just as important as quantity. Your training data must reflect the real-world data your model will encounter. For object detection, this means different angles, lighting, and backgrounds. For form processing, this means different layouts (which should be separated into collections).
2. Verify Your Labels and Tags
This is the "Garbage In, Garbage Out" principle. If your training data is incorrectly labeled, the model will learn the wrong things.
- Go back through your low-performing items.
- In a form processing model, ensure the correct text is tagged for each field.
- In an object detection model, check that bounding boxes are tight and correctly labeled.
3. Balance Your Data Distribution
A model trained on imbalanced data will be biased towards the majority case.
- For a prediction model, if you're predicting
Yes/Noand 98% of your training data isYes, the model will struggle to ever predictNo. You may need to find moreNoexamples or use techniques to balance the dataset. - This is less of a concern for form processing or object detection, but you should still ensure all your labels have a sufficient number of examples.
4. Review Top Influencers and Refine Columns (Prediction Models)
For prediction models, the model details page shows you which data columns had the most influence on the outcome.
- Use this for a sanity check. If you are predicting customer churn and the top influencer is
CustomerID, something is wrong. This suggests data leakage or an unwanted correlation. - Add or remove columns. If the model is underperforming, perhaps you are missing key data. Could you add columns with more information (e.g., adding customer tenure to a churn prediction model)? Conversely, removing irrelevant or noisy columns can sometimes help the model focus on the important signals.
AI Builder Performance Improvement Guides
The two articles we've used contain excellent, actionable checklists for improvement. Let's review their key recommendations.
First, review the sections 'Common questions', 'Add more documents to the training data', and 'More tips' in the 'Improve the performance of your document processing model' article.
Prediction model performance - AI Builder
Now, let's look at the guide for prediction models, which offers a slightly different but complementary set of strategies.
Read the entire 'Improve your prediction model performance' section. Focus on the concepts of reviewing top influencers, adding more data/columns, and checking data distribution.
Test your understanding!
You have trained a prediction model to determine if a project will finish "On Time" or "Late". After training, AI Builder gives the model a 'D' grade with an accuracy score of 99.8%.
- What is the most likely problem with this model?
- What are the first two things you would investigate to diagnose and fix this problem?
Show answer
-
The Problem: The model is almost certainly overfitting. A 'D' grade combined with a near-perfect accuracy score is the classic symptom. The model has likely found a column in the training data that directly reveals the outcome, allowing it to "cheat" on the test set. It will not perform well on new, real-world data where this "cheat" column isn't available or populated.
-
Diagnosis and Fix:
- Investigate Top Influencers: The first step is to go to the model's performance details page and look at the "Top Influencers" report. You will likely find one column with an extremely high influence percentage (e.g., 90%+). This is your prime suspect.
- Validate Data and Refine Columns: Examine that influential data column. It is probably something like a
ProjectActualCompletionDatecolumn that is only populated if the project is already finished, thus giving away theOn Time/Latestatus. The fix is to edit the model, deselect this problematic column from the list of features, and then retrain the model.
Conclusion
In this lesson, you've moved beyond simply building AI models to professionally assessing and refining them. This iterative cycle of evaluating performance and strategically improving the training data is fundamental to creating AI solutions that are robust and trustworthy.
Key Takeaways:
- AI Builder provides performance grades (A-D) and scores (Accuracy, R-squared) to evaluate models.
- Performance is relative; a good score depends on your data's baseline distribution. A 'D' grade with very high accuracy indicates overfitting.
- Evaluation involves drilling down into detailed reports to find specific areas of weakness (e.g., low-performing fields).
- Improvement is an iterative process focused on enhancing the training data:
- Adding more and varied examples.
- Correcting tags and labels.
- Balancing data distribution.
- Refining the features/columns used for training.
What's Next?
Now that you know how to build a custom model and ensure it performs well, you are ready to put it to work. In our next lesson, you will learn how to integrate a trained AI Builder model into a Power App to process user input or images, turning your intelligent model into a functional business application.