Hello! Welcome to the fourth lesson in our course.
In the last session, we focused on the technical blueprints of a system by learning how to interpret an API contract. You learned to identify endpoints, data models, and error types, giving you insight into what a system can do and how to interact with it.
Today, we shift our focus from the technical to the economic blueprint. It's not enough to know if a feature can be built; a systems architect must also determine if it should be built. This involves weighing the resources required against the value it will generate.
This leads us to our learning outcome: Create a spreadsheet with formulas to model basic cost-benefit calculations for a feature. By the end of this lesson, you'll be able to build a simple financial model to justify product decisions, a fundamental skill for prioritizing work and communicating its impact to stakeholders.
1. The "Why": Framing Decisions with Return on Investment (ROI)
Before we open a spreadsheet, let's understand the core concept. At its heart, a cost-benefit analysis is about calculating the Return on Investment (ROI). It's a simple but powerful ratio that turns assumptions into measurable outcomes. As a designer moving into an architectural role, this is how you translate the value of a better user experience into the language of business.
Let's start with a reading that frames this perfectly from a product perspective.
ROI Template: The Tool You Need to Measure Payoff Fast
This article from Product School, 'ROI Template: The Tool You Need to Measure Payoff Fast,' explains why ROI is a critical tool for making data-driven decisions in product development.
Read the first two sections: 'What Is ROI and How Is It Used in Product Development?' and the simple example calculation that follows. Focus on how this framework helps answer key questions about whether to build a feature.
As the article highlights, the basic formula is:
Where Net Benefit is simply the total financial gain (or benefit) minus the initial cost. An ROI of 300% means that for every dollar you invested, you got three dollars back in net benefit.
2. The "How": Building Your Cost-Benefit Model
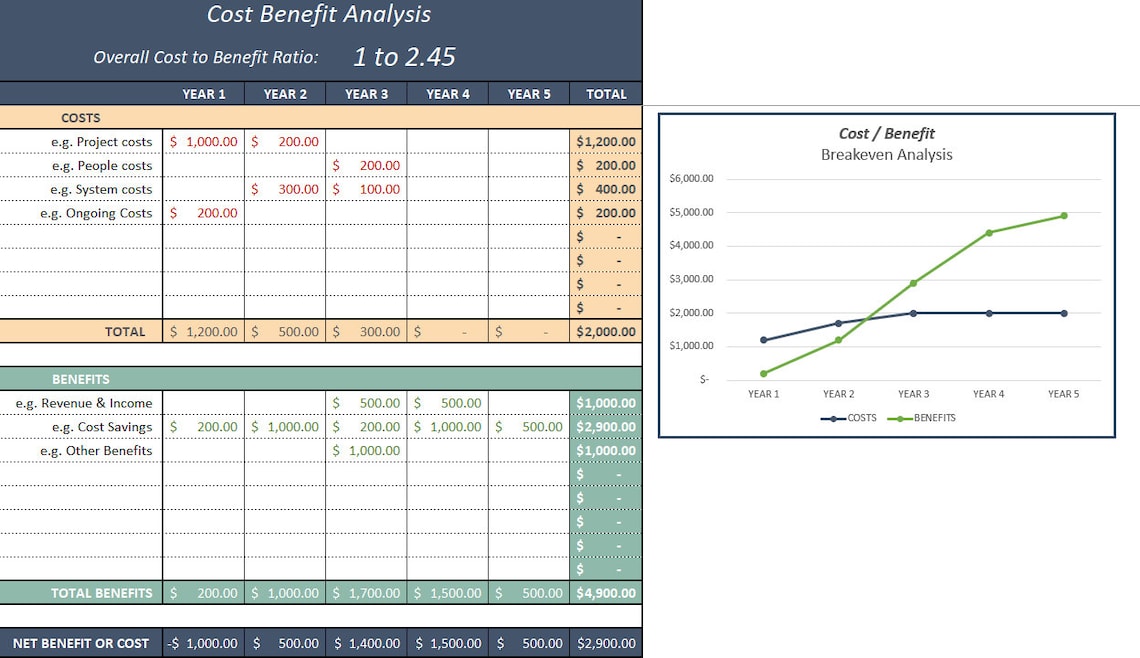
Now, let's get practical and build a model that calculates this for us. We will construct a spreadsheet that tracks costs and benefits over time to not only calculate ROI but also to find the break-even point—the moment when your investment has paid for itself.
Here's an example of the kind of analysis you will be able to produce by the end of this section.
2.1. Structuring Costs and Benefits
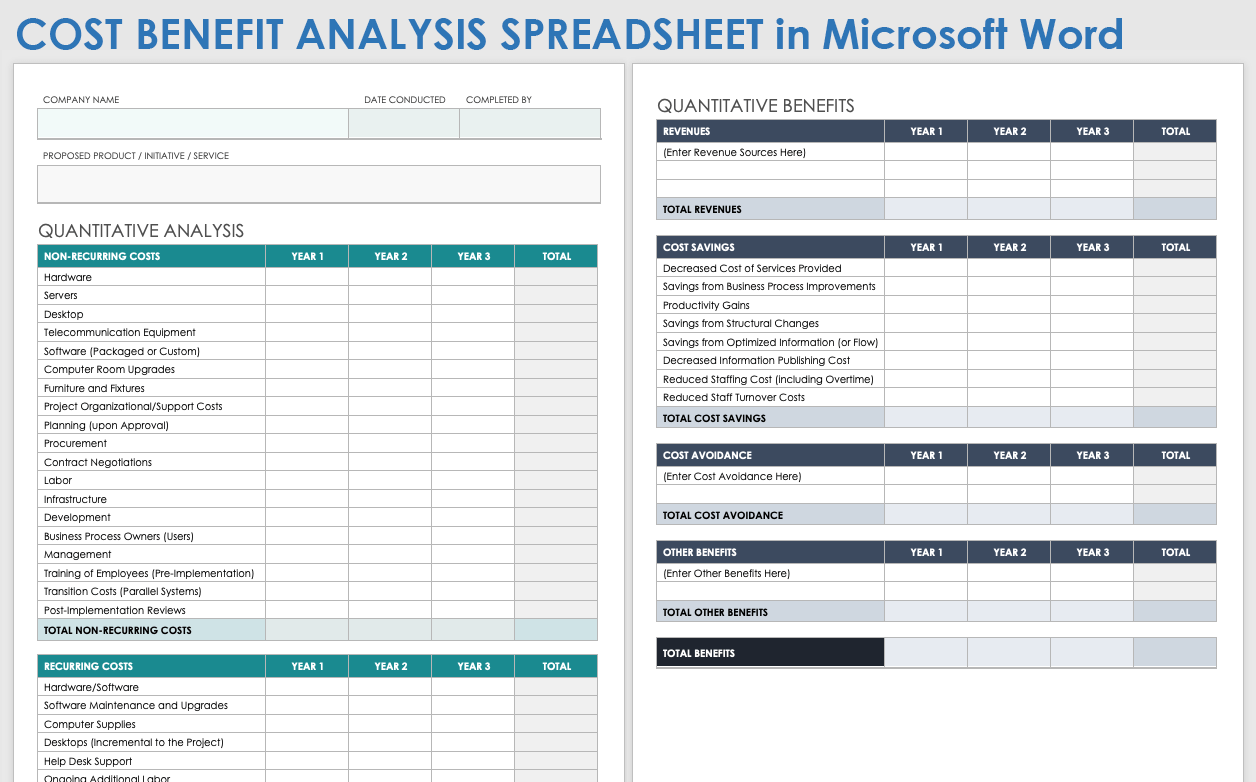
First, you need to identify the relevant costs and benefits. It's helpful to categorize them.
- Costs:
- One-Time Costs (or Non-Recurring): These are upfront investments, like the cost of design and engineering to build a feature, initial user research, or purchasing a new software license.
- Recurring Costs: These are ongoing expenses, like monthly server costs, software subscription fees, or ongoing maintenance and support staff time.
- Benefits:
- Increased Revenue: The most direct benefit. For example, a feature that increases the trial-to-paid conversion rate.
- Cost Savings: A feature that reduces operational costs. For example, an improved self-service portal that lowers the number of support tickets.
- Cost Avoidance: Benefits from preventing future costs, such as building a scalable system now to avoid a costly migration later.
2.2. Creating the Model and Break-Even Chart
We will now use a video tutorial as a step-by-step guide to build this model in a spreadsheet program like Excel or Google Sheets.
How to make Cost Benefit and Breakeven Analysis in Excel
This video, 'How to make Cost Benefit and Breakeven Analysis in Excel' by David McLachlan, provides a clear, hands-on walkthrough of creating the exact model we need.
Follow along with the video to build your own spreadsheet. We will watch it in segments: Setting Up Tables (02:10 - 04:37): Create your 'Costs' and 'Benefits' tables with columns for several years and a 'Total' column. Use the SUM formula to calculate totals for each row and column. Calculating Net Benefit (04:37 - 05:56): Create a 'Net Benefit' row where you subtract total costs from total benefits for each year (=Total_Benefits - Total_Costs). Modeling for Break-Even (07:17 - 11:35): This is the most important part. First, create 'Cumulative Cost' and 'Cumulative Benefit' rows. Then, use this data to create a line chart that visually shows the break-even point.
By the end of this exercise, you should have a functional spreadsheet that automatically updates the net benefit and the break-even chart as you change your cost and benefit numbers.
3. A Practical Application: Calculating ROI for a UX Redesign
Let's connect this directly to your work as a UI/UX designer. Abstract calculations are useful, but their real power comes from applying them to concrete decisions.
Imagine you want to propose a complete redesign of the user onboarding flow for a SaaS product. You believe it will improve user retention, but the project will require significant design and engineering effort. This is a perfect scenario for a cost-benefit analysis.
Let's refer back to the Product School article for a specific example of calculating UX/Design ROI.
ROI Template: The Tool You Need to Measure Payoff Fast
Let's revisit the 'ROI Template' article to see a specific example of applying this model to a design-led initiative.
Read subsection 5, 'UX/Design ROI: Measuring the impact of user experience changes.' Pay close attention to how they quantify the benefit (increased conversion) against the design cost.
Your Turn to Model:
Now, try to model this onboarding redesign scenario in the spreadsheet you just built. You don't need exact numbers; the goal is to practice thinking through the inputs.
-
Estimate the Costs (for Year 1):
- Design Cost: Your time for research, wireframing, and high-fidelity mockups. Let's say this is 80 hours at a blended rate of $100/hour = $8,000.
- Engineering Cost: The developer time to build and test the new flow. Let's estimate 120 hours = $12,000.
- Total One-Time Cost = $20,000. Enter this into your spreadsheet.
-
Estimate the Benefits (over Years 1, 2, and 3):
- Increased Revenue: Assume the current product has 1,000 new users per year, a 5% conversion rate to a $500/year plan. This is
1000 * 0.05 * 500 = $25,000in annual revenue from new users. - You project your new onboarding will increase the conversion rate from 5% to 7%.
- The new revenue would be
1000 * 0.07 * 500 = $35,000. - The benefit is the additional revenue: $35,000 - $25,000 = $10,000 per year.
- Enter this benefit for Year 1, Year 2, and Year 3 in your spreadsheet.
- Increased Revenue: Assume the current product has 1,000 new users per year, a 5% conversion rate to a $500/year plan. This is
What does your model show? You should see that you break even in Year 2. Now, calculate the total ROI over three years using the formula from the CaptivateIQ article (LINK):
- Total Cost: $20,000
- Total Benefit: $10,000 * 3 = $30,000
- Net Benefit: $30,000 - $20,000 = $10,000
- ROI:
($10,000 / $20,000) * 100 = 50%
You now have a defensible business case for your design initiative.
Conclusion
Today, you've added a crucial economic modeling tool to your architect's toolkit. You've moved beyond the technical "how" to the strategic "why" and "when." Being able to model the financial impact of a feature is essential for making smart, data-driven decisions and for effectively communicating the value of your work.
Key Takeaways:
- Cost-Benefit Analysis is a structured way to evaluate whether an investment (like building a feature) is financially sound.
- The Return on Investment (ROI) formula quantifies the profitability of an investment.
- The Break-Even Point is the point in time when the cumulative benefits of an investment have fully paid off the cumulative costs.
- A simple spreadsheet is a powerful tool for modeling costs (one-time and recurring) and benefits (revenue gains, cost savings) to build a business case for a product or feature decision.
In our next lesson, we will continue our journey into economic modeling by focusing on two of the most important metrics for modern software businesses: Customer Acquisition Cost (CAC) and Lifetime Value (LTV). This will give you a more sophisticated way to model the "benefit" side of your calculations, especially for subscription-based products.