Hello! Welcome to the first lesson in our new module, "Reading Charts and Market Behavior."
In the last two modules, we focused on fundamental analysis—evaluating a company's business health, profitability, and valuation to determine its intrinsic worth. You learned how to read financial statements and use a stock screener to find companies that meet your criteria. This is like inspecting a car's engine and build quality before buying it.
Now, we're shifting gears to technical analysis. Instead of looking at the company, we'll look at the stock's price and volume history. Technical analysis tries to understand market psychology and predict future price movements based on past patterns. It's less about the car's engine and more about tracking the car's speed and direction on the road.
Today, your goal is to learn how to calculate and interpret a Simple Moving Average (SMA) to identify the primary trend. The SMA is one of the most fundamental and widely used technical indicators. It's a foundational tool that will help you cut through the "noise" of daily price fluctuations to see the bigger picture, whether you're analyzing a stock for a long-term investment or a short-term trade.
1. What is a Simple Moving Average?
At its core, a Simple Moving Average is exactly what it sounds like: it's the average price of a stock over a specific number of time periods, plotted as a line on a chart. Its primary job is to smooth out erratic price action to make the underlying trend easier to see.
To get a clear visual and conceptual introduction, let's watch a short video.
What is Moving Average? 📈 [Explained]
The video 'What is Moving Average? 📈 [Explained]' by VRDNation provides a great high-level overview of what a moving average is, how it's calculated in principle, and what it looks like on a real chart.
Watch the video from the beginning until 02:04, and then from 03:29 to 04:47. Focus on understanding the core purpose: smoothing out price fluctuations to see the big picture trend (bullish or bearish).
As the video explained, the main benefit of an SMA is that it gives you a cleaner, less noisy view of a stock's price direction. Now, let's get practical and learn exactly how that line is created.
2. How to Calculate the SMA
While your brokerage platform will automatically calculate and plot the SMA for you (as shown briefly in the video), understanding the calculation is key to using it effectively. It's not a magical line; it's just simple arithmetic.
An SMA is calculated by summing the closing prices of a stock over a set period and then dividing by the number of periods. The "moving" part comes from the fact that with each new period, the oldest data point is dropped and the newest one is added.
The following resource provides a very clear, step-by-step example of this calculation.
The article 'Moving averages' from Wealthsimple has an excellent section that walks you through calculating a 10-day SMA for a hypothetical stock. This will solidify your understanding of the mechanics.
Read the sections 'Simple moving average vs. exponential moving average' (just the SMA part) and 'How to calculate a moving average' (again, just the SMA calculation). Follow the step-by-step math for the 10-day and 11-day SMA calculation.
This simple, rolling calculation is what creates the smooth line you see on a chart. Because it's an average of past prices, the SMA will always lag behind the current price. This is an important characteristic to remember.
3. Interpreting the SMA to Identify the Trend
Now for the most important part: using the SMA to make sense of a chart. There are two primary ways to interpret the SMA to identify the primary trend.
1. The Direction of the SMA Line
The slope of the moving average line itself tells you the direction of the trend.
- An upward-sloping SMA indicates an uptrend.
- A downward-sloping SMA indicates a downtrend.
- A flat or sideways SMA suggests a ranging or trendless market.
2. The Price Relative to the SMA Line
The relationship between the stock's current price and the SMA line provides confirmation of the trend's strength.
- In a strong uptrend, the price will consistently stay above the SMA. The SMA often acts as a "floor" or support level.
- In a strong downtrend, the price will consistently stay below the SMA. The SMA often acts as a "ceiling" or resistance level.
Take a look at the chart below. It shows a 20-day SMA applied to a stock in an uptrend.
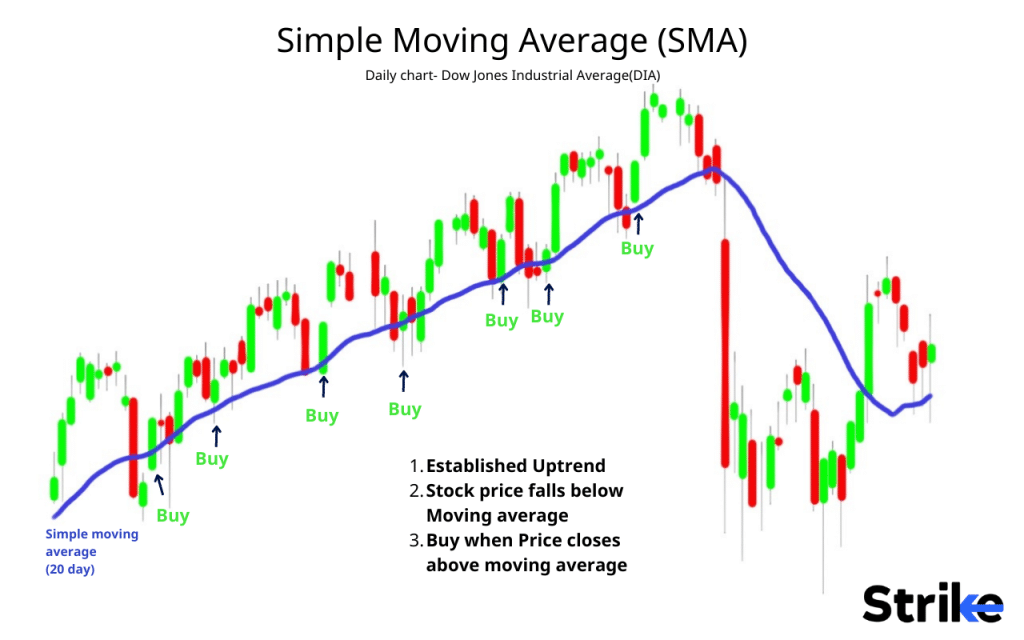
When the price crosses decisively above or below the SMA, it can signal a potential change in the trend.
Test your understanding!
Look at the chart above again. Towards the far right side of the chart, the price breaks and closes significantly below the 20-day SMA. What might this indicate about the primary trend?
Show answer
The decisive break below the 20-day SMA, after a long period of staying above it, could signal that the previous uptrend is losing momentum and may be reversing into a new downtrend.
4. Choosing the Right SMA Period
You've seen references to 10-day, 20-day, and even 200-day moving averages. The period you choose is critical and depends entirely on your investment or trading time horizon. This is where your dual interest in long-term investing and active trading comes into play.
- Short-term traders (day traders, swing traders) prefer shorter periods (e.g., 10, 20, 50-day SMAs) because they react more quickly to recent price changes. This sensitivity helps in identifying short-term momentum.
- Long-term investors prefer longer periods (e.g., 100, 200-day SMAs). These SMAs are much smoother and are used to identify the major, long-term primary trend, ignoring short-term volatility. The 200-day SMA is a widely watched benchmark for the overall health of a stock or market.
This next reading breaks down the most popular SMA periods and their common uses.
Simple Moving Average Trading Strategies ...
To help you choose the right tool for the job, the article 'Simple Moving Average Trading Strategies' from TradingSim explains the popular SMA settings and who uses them.
Read the section 'Popular Simple Moving Averages'. Pay close attention to the descriptions for the 20-SMA, 50-SMA, and 200-SMA, and how they relate to short-term, mid-term, and long-term trends.
A common technique is to use multiple SMAs on one chart (e.g., a 50-day and a 200-day) to get a sense of both the intermediate and long-term trends at the same time.
Conclusion
You've just learned about your first technical indicator, the Simple Moving Average. It's a versatile tool that cuts through market noise to help you identify the direction and strength of a trend. By understanding how it's calculated and how different periods serve different goals, you can apply it to both your short-term trading and long-term investing analysis.
Key Takeaways:
- The Simple Moving Average (SMA) is the average closing price of a stock over a specified number of periods.
- Its main purpose is to smooth out price data to make the underlying trend clearer.
- You can identify the primary trend by observing the slope of the SMA (up, down, or flat) and the position of the price relative to the SMA (above or below).
- Shorter SMA periods (like 20) are for analyzing short-term trends, while longer SMA periods (like 200) are for analyzing long-term trends.
A Look Ahead:
The SMA is a powerful tool, but its simplicity is also its main weakness: it gives equal weight to every price in its calculation period. What if we wanted an average that focused more on what's happening right now?
In the next lesson, we will explore the Exponential Moving Average (EMA). You'll learn how it differs from the SMA by giving more weight to recent prices, making it more responsive to new information. This will allow you to contrast the two and decide which is better suited for different market conditions and strategies.