Hello! Welcome to your fifth lesson in our course on investing.
In our last lesson, we demystified stock charts by learning how price movements are driven by the fundamental economic forces of supply and demand. You learned that a stock's price at any moment is simply the equilibrium point where buyers and sellers agree.
However, a company's stock price alone doesn't tell you how big or valuable the company is. A $10 stock could belong to a larger company than a $1000 stock. Today, we'll explore the metric that gives us this crucial context.
Our learning outcome is to define market capitalization and its role in classifying companies (e.g., large-cap, mid-cap). This concept is a fundamental building block for you as an investor. It's one of the first filters you'll use to sort through the thousands of stocks in the market to find ones that fit your goals, whether you're looking for stable, long-term growth or are interested in the higher-risk, higher-reward world of active trading.
What is Market Capitalization?
Imagine two pizzas. One is cut into 4 large slices, and each slice costs $8. The other is cut into 16 small slices, and each slice costs $3. Which pizza is more expensive overall?
- Pizza 1: 4 slices × $8/slice = $32
- Pizza 2: 16 slices × $3/slice = $48
Even though a slice of the first pizza is more expensive, the second pizza is larger and more valuable overall.
The stock market works the same way. The share price is the price of one "slice." To find the value of the whole "pizza" (the company), you need to know the price per slice and the total number of slices. This total value is called market capitalization, or "market cap."
Market capitalization is the total dollar value of all of a company's outstanding shares of stock.
To get a formal definition and see the simple formula, let's watch a short video clip.
Small Cap Stocks vs Large Cap Stocks: Key Differences Every Investor Should Know
This video from Martik Finance provides a concise definition of market capitalization and how it's calculated.
Watch from 00:34 to 01:13. Focus on the definition and the simple formula presented.
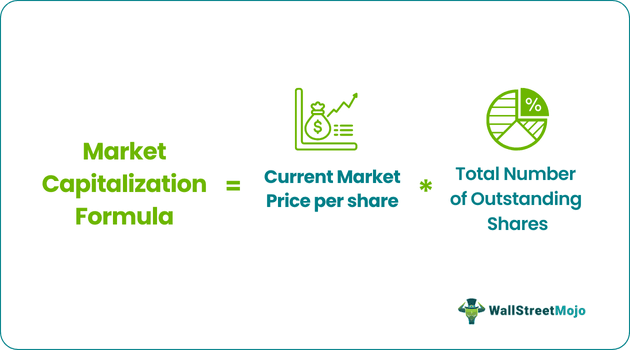
As the video explained, the formula is straightforward:
Let's consider a practical example:
- Company A has a stock price of $200 per share and 50 million shares outstanding.
- Market Cap = $200 × 50,000,000 = $10 billion.
- Company B has a stock price of $50 per share and 400 million shares outstanding.
- Market Cap = $50 × 400,000,000 = $20 billion.
Even though Company A's stock price is four times higher, Company B is actually twice as large in terms of total market value. This is why market cap, not share price, is the correct metric for gauging a company's size.
Classifying Companies by Size
Now for the practical application. Investors use market cap to sort companies into different categories. This classification system gives you immediate insight into a company's general characteristics, such as its potential for growth and its level of risk.
The main categories are:
- Large-Cap
- Mid-Cap
- Small-Cap
Let's read a clear breakdown of these categories and their typical dollar values from Fidelity.
What is market cap and how do you calculate it?
This article from Fidelity, a major brokerage firm, clearly defines the standard market cap segments. This is the language investors use to categorize stocks.
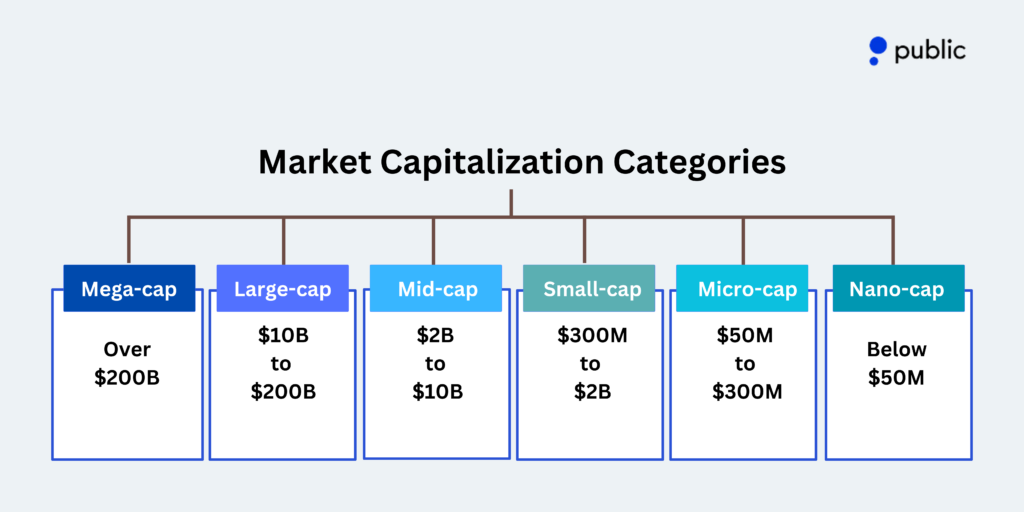
Read the section titled 'Market cap segments'. Focus on the definitions and market cap ranges for large-cap, mid-cap, and small-cap companies. Also, note the additional categories of mega-cap and micro-cap.
Here is a visual summary of those categories:
The Investor's Perspective: Risk, Growth, and Stability
Knowing a company's market cap category is far more than just trivia. It directly relates to the investment characteristics you can expect, which is vital for both long-term investing and active trading.
The following video provides an excellent overview of the practical differences between these categories, including their risk and growth profiles. It even uses examples like Amazon and Netflix when they were small-cap stocks, which really brings the concept to life.
Small Cap Stocks vs Large Cap Stocks: Key Differences Every Investor Should Know
Let's dive into what these categories mean for you as an investor. This video explains the different risk and growth profiles of small-cap, mid-cap, and large-cap stocks.
Watch from 01:00 to 06:22. Pay close attention to the descriptions of each category's typical characteristics: growth potential, stability, risk factors, and dividend likelihood.
Here's a summary of the key characteristics:
| Category | Typical Market Cap | Characteristics | Investor Angle |
|---|---|---|---|
| Large-Cap | > $10 Billion | Well-established, industry leaders (e.g., Apple, Coca-Cola). More stable, often pay dividends. Slower growth. | Often form the core of a long-term, buy-and-hold portfolio due to their stability. |
| Mid-Cap | $2 Billion to $10 Billion | Established businesses that are still in a growth phase. A blend of the stability of large-caps and the growth potential of small-caps. | Offer a "sweet spot" for investors seeking growth without the extreme volatility of small-caps. |
| Small-Cap | $300 Million to $2 Billion | Younger companies, often in new or niche industries. Higher growth potential, but also higher risk, more volatility, and higher failure rate. | Can be attractive for investors with a higher risk tolerance seeking significant returns. A common area for active traders. |
Given your interest in philosophy and psychology, it's interesting to note how investor sentiment differs across these categories. There's often more hype and "fear of missing out" (FOMO) around promising small-caps, while large-caps are seen as boring but reliable stalwarts. Understanding this can help you maintain emotional discipline.
Test your understanding!
A company has 25 million outstanding shares, and its stock is currently trading at $500 per share.
- What is its market capitalization?
- Based on the standard definitions, what category would this company fall into?
- What general characteristics might you expect from this type of company?
Show answer
- Market Cap: 25,000,000 shares × $500/share = $12.5 billion.
- Category: With a market cap of $12.5 billion, this is a large-cap company.
- Characteristics: You would generally expect it to be a well-established leader in its industry, with relatively stable earnings. It might have slower growth compared to smaller companies but could also be less risky and potentially pay a dividend.
A Practical Tip for Beginners
When you're just starting, the sheer number of small, unknown companies can be overwhelming and risky. A common piece of practical advice is to begin by focusing your research on larger, more established companies.
How To Read A Stock Chart | Investing For Complete Beginners
For a simple, actionable strategy as you begin your investing journey, watch this short clip on where to focus your attention.
Watch from 05:44 to 06:35. Note the practical tip the speaker gives for beginners regarding market cap.
The advice to initially focus on companies with a market cap above $10 billion (large-caps) is a simple risk-management technique. These "blue-chip" stocks tend to have more predictable business models and are less likely to experience the extreme volatility that can wipe out a new investor's capital.
Conclusion
In this lesson, you've learned a critical method for evaluating and categorizing companies. You've moved beyond looking at just the stock price to understanding a company's true market size.
Here are your key takeaways:
- Market capitalization is the total value of a company in the stock market, calculated as Share Price × Number of Outstanding Shares.
- It is the primary metric for judging a company's size, not its stock price.
- Companies are classified into large-cap, mid-cap, and small-cap categories, which give investors a quick guide to their potential risk and growth profiles.
- Large-caps tend to be more stable, while small-caps offer higher growth potential at the cost of higher risk.
In our next and final lesson of this introductory module, we will bring this concept down to a personal level. We will learn how to calculate the value of a stock position—that is, the value of the shares you personally own. This is the number you will see in your brokerage account and is the first step toward tracking your own investments.