Hello again. In the previous lesson, you mapped the people around an information asset: producers, owners, stewards, custodians, protection partners, and consumers. That stakeholder map is the starting point for good requirements work. Before anyone builds a report, pipeline, database, or cloud solution, the team needs to know who needs information, what decision they must make, and how reliable and timely that information must be.
This lesson shows how to translate a vague business problem into measurable information requirements. You will work from a realistic customer-service scenario, define decision-focused questions and KPIs, then express data, quality, timing, and access needs in testable language. This is a core skill for information architects: it connects business value to future architecture choices without jumping prematurely to a tool or cloud service.
Start with a decision—not a dashboard
Organizations often begin with requests such as:
- “We need a customer-service dashboard.”
- “Give us better visibility.”
- “Put all our data in Azure.”
- “We need real-time reporting.”
These are understandable requests, but they are not yet requirements. They describe an imagined solution or a general desire, not the business outcome the solution must support.
A stronger starting point is a business problem:
Customer-support leaders cannot see quickly which queues, issue types, or channels are causing delayed resolution and poor customer experience. As a result, they cannot reliably prioritize staffing, training, or process improvements.
Now ask the question that turns reporting into something useful:
What decision or action should better information enable?
For this example, the answers might be:
- Reassign staff to overloaded support queues.
- Escalate recurring technical issues to the product team.
- Give targeted coaching to agents or teams.
- Change an approval or service process that causes delay.
- Monitor whether interventions improve customer outcomes.
The dashboard, report, or alert is only a possible delivery mechanism. The actual value lies in enabling a person to take a better action at the right time.
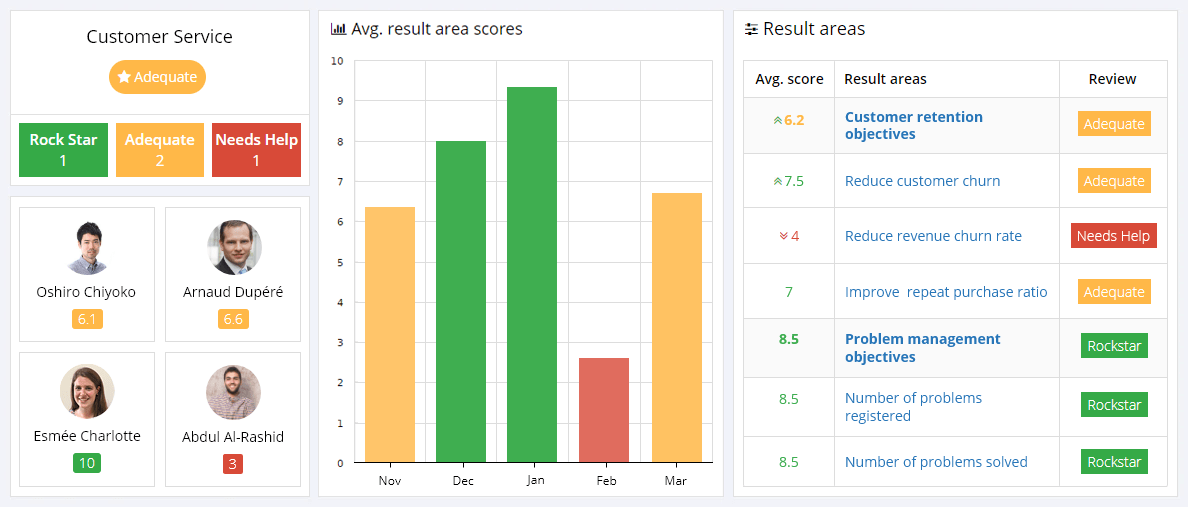
A dashboard like this can display ratings and trends, but several essential questions remain:
- What exactly does “adequate” mean?
- What period does each score cover?
- Which cases count in the result?
- Who reviews a poor score?
- What action is expected when a threshold is missed?
- Can the figures be trusted enough to make staffing or performance decisions?
Those unanswered questions are the gap that information requirements fill.
A helpful chain is:
Do not reverse this chain. Starting with “we need Power BI” or “we need an Azure data lake” risks building a technically competent solution that answers the wrong question.
From an outcome to answerable questions
A business objective should state an intended result and, where possible, make success measurable.
Compare these two statements:
| Weak statement | Stronger statement |
|---|---|
| Improve customer service. | Increase first-contact resolution from its agreed baseline to by the end of the next quarter, while maintaining customer satisfaction at or above its agreed baseline. |
| Reduce support delays. | Reduce the percentage of eligible cases unresolved after two business days to below by 30 September. |
| Understand customer issues better. | Identify the top five issue categories responsible for repeat contacts each week, so the support and product teams can prioritize corrective actions. |
The stronger forms are not “better” because they contain more numbers. They are better because they establish:
- The outcome — what should improve?
- The measurement — what will show the improvement?
- The target — what level is acceptable or desired?
- The timeframe — by when?
- The decision context — what will people do differently?
A target should be agreed with the accountable business owner. Do not invent a target merely to make a requirement look precise. If the organization does not yet know a reasonable threshold, state that the first requirement is to establish a baseline.
For example:
During the first four weeks, the Support Operations Manager will establish and approve the baseline first-contact-resolution rate by channel and issue category. The baseline will be used to set quarter-end improvement targets.
That is still measurable because it identifies the owner, time period, output, and approval event.
Before continuing, review Microsoft’s distinction between collaborative business design and later technical design. The key point is that requirements gathering starts with users and the business problem, then validates whether the necessary data and technical capabilities exist.
Power BI implementation planning: BI solution planning - Power BI | Microsoft Learn
Read Microsoft Learn’s “Power BI implementation planning: BI solution planning.” It provides a practical model for gathering business requirements first and then translating them into technical requirements.
In “Step 1: Gather requirements,” read the collaboration rationale. Focus on why business users must participate rather than simply receiving a finished report. Then, in “Gather business requirements,” find the paragraph beginning “The business design concludes with the following deliverables.” Read the business-design deliverables, especially the distinction between business metrics, business attributes, and supplemental requirements. Finally, in “Gather technical requirements,” read the technical-design purpose. Notice that field mappings and calculation logic validate the business design; they should not replace it.
Separate the business requirement from the information requirement
Requirements occur at several connected levels. Keeping them separate makes conversations clearer and prevents teams from treating technical decisions as business needs.
Consider this customer-service scenario.
1. Business requirement
Support leaders need to reduce repeat customer contacts and unresolved cases so that service quality improves and operating costs do not rise unnecessarily.
This describes the business need, but it does not yet specify information.
2. Decision and action requirement
Each weekday, the Support Operations Manager must be able to identify queues and issue categories requiring staffing, process, or product escalation.
This says who needs to act and what type of action is expected.
3. Information questions
The decision-maker may need answers to questions such as:
- Which support queues have the highest backlog right now?
- Which issue categories have the lowest first-contact-resolution rate this week?
- Are repeat contacts concentrated in a particular channel, product, region, or customer segment?
- Which cases are approaching their service-level deadline?
- Has a staffing or process change improved results compared with the prior period?
Questions are powerful because business users and technical teams can discuss them in ordinary language. A question is also easier to challenge: if no action depends on the answer, it may not deserve priority.
4. Information requirements
An information requirement states what information must be available, with enough precision to build and test a solution.
For example:
By 08:00 each business day, the Support Operations Manager shall be able to view the prior day’s first-contact-resolution rate, repeat-contact rate, open-case backlog, and average time to resolution, segmented by queue, channel, issue category, region, and support team.
That statement contains several measurable elements:
- User: Support Operations Manager
- Timing: by 08:00 each business day
- Measures: four named metrics
- Dimensions: queue, channel, issue category, region, team
- Purpose: operational review and intervention
It is much stronger than “Create a customer-service dashboard.”
Metrics need definitions, not just names
A key performance indicator (KPI) is a metric connected to a business objective or target. However, a label such as “resolution rate” is not a sufficient KPI definition. Different teams may calculate it differently while believing they are discussing the same thing.
A usable KPI definition specifies the business meaning and calculation rules.
Example: first-contact resolution
Suppose the organization wants to measure whether a customer’s issue was resolved without requiring another contact.
A candidate definition could be:
This is only a starting definition. The team must also decide:
- What counts as an eligible case?
- Does a customer contact by a different channel count as follow-up?
- Are duplicate cases excluded?
- Are cases reopened by an agent treated differently from cases reopened by a customer?
- Is the reporting date the case-created date or case-closed date?
- Does the seven-day window mean calendar days or business days?
- Who approves the definition?
Without these rules, two analysts can produce two different first-contact-resolution figures from the same source system.
A useful KPI specification includes the following:
| KPI component | Example requirement |
|---|---|
| Name | First-contact resolution rate |
| Business purpose | Shows whether customers receive a successful resolution without needing repeat assistance |
| Definition | Percentage of eligible closed cases with no customer-initiated follow-up contact within seven calendar days |
| Numerator | Eligible cases resolved without a qualifying follow-up contact |
| Denominator | All eligible cases closed during the reporting period |
| Reporting grain | One row or aggregate value per date, queue, channel, issue category, region, and support team |
| Source | Approved customer-support case-management system and linked interaction records |
| Refresh frequency | Daily by 08:00 local time |
| Target or threshold | Target and warning threshold approved by Support Operations |
| Owner | Support Operations Manager |
| Steward | Customer Service Data Steward |
| Quality rule | At least of closed eligible cases must contain a valid queue, channel, and closure timestamp |
The grain is particularly important. It means the level of detail at which information must be available. If the business needs to compare performance by queue and day, monthly totals alone will not meet the requirement.
Lagging and leading indicators
Not every useful measure reports a final outcome.
- A lagging indicator reports a result that has already occurred. Examples include average resolution time last month, customer satisfaction score, or repeat-contact rate.
- A leading indicator signals a condition that may affect a future result. Examples include rising backlog, cases nearing a service-level deadline, an increase in a new issue category, or a sudden fall in staffing coverage.
A good operational information requirement often combines both:
The daily service-performance view shall show outcome measures, including first-contact resolution and repeat-contact rate, together with early-warning measures, including open backlog and cases due to breach their service-level deadline within the next four business hours.
The outcome measures show whether performance has improved. The early-warning measures help the team act before the outcome worsens.
This short video gives a useful checklist for making KPIs operational: the measure, target, source, and review frequency.
How to Develop Key Performance Indicators
Watch “How to Develop Key Performance Indicators” from OnStrategy I Virtual Strategist. It gives a compact explanation of the components that turn a metric name into an actionable KPI.
Watch KPI foundations for the relationship between objectives, measures, targets, sources, and reporting frequency. Then watch indicator types for the distinction between leading and lagging measures. Relate each element to the customer-service KPI specification above.
Turn questions into data requirements
Once questions and measures are defined, the next task is to determine what data is needed to answer them. This is where information architecture begins to become concrete.
For the customer-service scenario, an initial source and field map might look like this:
| Information needed | Likely source | Required data elements | Why it is needed |
|---|---|---|---|
| Case volume, status, timestamps | Case-management application | Case ID, created time, closed time, status, queue, assigned team | Calculates backlog and resolution time |
| Customer follow-up contacts | Case-management application or contact-center platform | Customer ID, contact time, channel, related case ID | Identifies repeat contacts |
| Service-level performance | Case-management application | Service-level target, due time, breach flag, priority | Identifies cases at risk of breach |
| Reason for contact | Case-management application | Issue category, subcategory, product, resolution code | Finds recurring causes and escalation areas |
| Customer satisfaction | Survey platform | Survey response, score, response time, related case ID | Tests whether service changes affect customer experience |
| Business context | CRM or customer master | Customer segment, region, account tier | Allows analysis by affected customer group |
At this stage, use business-friendly names such as “case-management application” rather than assuming a particular vendor or service. The organization may later decide whether the information will be integrated using Azure Data Factory, stored in Azure SQL, modeled in Fabric, or served through Power BI. Those are technical-design decisions.
A complete information requirement normally addresses more than fields and sources.
A practical information-requirements checklist
For each decision-support need, establish:
-
Purpose and decision
What problem does this information help solve? What decision or action follows? -
Users and roles
Who consumes the information? Who owns the metric definition? Who maintains quality? Who approves access? -
Questions and metrics
What must users be able to answer? What calculation, target, reporting period, and comparison are required? -
Attributes and dimensions
How must users filter, group, or compare the measures? Examples: date, region, queue, product, customer segment, channel. -
Sources and authoritative status
Which system supplies each element? Which source is authoritative if systems disagree? -
Time and history
How current must the information be? How much historical data is required for comparison? -
Quality expectations
What completeness, validity, uniqueness, consistency, and timeliness levels are acceptable? -
Delivery and usability
Does the user need a dashboard, scheduled report, data extract, alert, API, or direct query? On which device or in which workflow? -
Protection and compliance constraints
Does the information contain personal, confidential, financial, or regulated data? Who should be allowed to see detailed records versus aggregated results?
The last item does not require you to master security controls yet. It simply ensures that privacy, sensitivity, and access requirements are captured early rather than discovered after development.
The next reading provides a helpful bridge from business questions to source, refresh, quality, and consumption requirements.
A Practical Guide to Scoping Business & Data Requirements for Analytics Projects - Enablerminds
Read the relevant sections of Enablerminds’ practical guide. Use it as a checklist for converting an agreed business objective into questions and scoped data needs.
In “Capture Business Requirements and Translate into Data Questions,” read the example questions. Notice that each is narrow enough to investigate, but connected to a larger business outcome. Then move to “Scope the Data Requirements.” Read the data-scoping checklist. Focus especially on data objects, ingestion or refresh frequency, historical duration, quality checks, and consumption method.
Make requirements testable
A requirement is testable when a person can determine objectively whether the delivered solution meets it. Avoid vague words such as “fast,” “high quality,” “user friendly,” “near real time,” or “secure” unless the requirement explains what they mean.
Here are examples for the customer-service scenario.
| Vague request | Testable information requirement | Example validation approach |
|---|---|---|
| Show customer-service performance. | The daily service-performance view shall display first-contact resolution, repeat-contact rate, backlog, and average resolution time by queue and issue category. | Confirm that all four measures and both dimensions appear and return results. |
| Make the data current. | Prior-day case and interaction data shall be available by 08:00 local time on each business day. | Monitor refresh completion for five consecutive business days. |
| Ensure the report is accurate. | At least of eligible closed cases shall have nonblank valid values for closure timestamp, queue, channel, and issue category. | Profile the source or curated dataset and calculate completeness. |
| Let managers investigate poor results. | Users with the Support Manager role shall be able to filter service metrics by date, queue, channel, issue category, region, and support team. | Test each approved filter with a manager account. |
| Stop service-level failures. | The operational view shall identify open cases due to breach their service-level deadline within the next four business hours. | Compare displayed at-risk cases to source-system due times. |
The specific values—such as , 08:00, or four business hours—are scenario choices, not universal standards. In real work, they must be negotiated with stakeholders and balanced against source-system limitations, cost, operational risk, and the value of faster information.
A requirement may also have an explicit assumption:
Assumption: The case-management system records a reliable link between a follow-up customer contact and the original case.
If technical investigation shows that the link is missing or unreliable, the first-contact-resolution KPI may need a revised definition, a new data-capture process, or a phased implementation. Discovering that early is success, not failure.
Build a compact requirements brief
For portfolio work and entry-level architecture discussions, a one-page requirements brief is more useful than a large collection of unstructured notes. It makes your reasoning visible before you draw a solution diagram.
Here is a concise version for the running scenario.
| Section | Example content |
|---|---|
| Business problem | Support leaders cannot identify the drivers of delayed resolution and repeat contacts early enough to intervene. |
| Business objective | Improve first-contact resolution while reducing unresolved cases and maintaining customer satisfaction. |
| Primary users | Support Operations Manager, queue supervisors, service-improvement analyst. |
| Business owner | Support Operations Manager. |
| Data steward | Customer Service Data Steward. |
| Key decisions | Reallocate staff, escalate recurring issue categories, revise processes, assign coaching. |
| Information questions | Which queues have rising backlog? Which categories have low first-contact resolution? Which cases are close to service-level breach? |
| Measures | First-contact resolution rate, repeat-contact rate, open backlog, average resolution time, cases at risk of breach, customer satisfaction score. |
| Required dimensions | Date, queue, channel, issue category, product, region, support team, customer segment. |
| Sources | Case-management system, contact-center interaction platform, customer survey platform, customer master or CRM. |
| Timeliness | Prior-day reporting by 08:00; at-risk case list refreshed during operating hours, subject to feasibility validation. |
| Quality requirements | Agreed completeness and validity thresholds for key fields; reconciliation of case counts to the authoritative source. |
| Protection requirement | Agent-level performance detail visible only to authorized supervisory roles; broader users receive aggregated views where appropriate. |
| Validation | Support Operations Manager confirms metric definitions, sample figures, filters, refresh timing, and intended actions before release. |
This brief is not a full technical specification. It is a shared contract between business, governance, and technical stakeholders about what the information solution must accomplish.
The roles from the previous lesson now have a practical function:
- The business owner approves purpose, priorities, KPI definitions, and trade-offs.
- The steward documents definitions, source context, quality rules, and known limitations.
- The consumer explains the real decision process and validates whether the information supports it.
- The custodian and technical teams determine how the information can be delivered reliably and safely.
- The architect connects these requirements to an information flow and a feasible target design.
Common mistakes to avoid
Beginning with the tool
“Build this in Power BI,” “put it in Fabric,” or “use Azure Data Factory” may eventually be sensible decisions. They do not explain the business value, required measures, or expected action.
Naming a metric without defining it
“Customer churn,” “active customer,” “resolution time,” and “revenue” can each have several valid definitions. Always document population, calculation, date basis, exclusions, and owner approval.
Collecting fields without identifying decisions
A long list of requested fields can create a wide dashboard with little value. Start with the question and decision; then identify the minimum information needed.
Using “real time” as a substitute for a requirement
Ask instead:
- How late can the information be before the decision loses value?
- Does the user need an immediate alert, hourly refresh, daily report, or monthly trend?
- Which measure actually needs that speed?
Many strategic decisions need daily or weekly information, while a small number of operational cases may justify a faster alert.
Treating data quality as a later cleanup task
If a KPI needs issue category, closure timestamp, and queue, define quality expectations now. A beautifully designed report cannot compensate for missing or inconsistent source data.
Forgetting ownership and validation
A report should not be accepted merely because it refreshes. The business owner or designated user must validate that the metric definitions, filters, figures, and decision flow are fit for purpose.
Key takeaways
A business problem becomes an information requirement through a deliberate translation process:
- Define the business outcome, not a preferred tool.
- Identify the user, decision, and action that information must support.
- Turn the decision into specific answerable questions.
- Define KPIs with clear meaning, formula, source, reporting grain, target, and review frequency.
- Specify required attributes, sources, history, timeliness, quality, delivery, and protection constraints.
- Write requirements so they can be tested and accepted.
- Capture assumptions and involve the owner, steward, consumers, and technical stakeholders early.
A useful standard is this:
A requirement is strong when a business stakeholder can explain why it matters, a steward can define it, and a technical team can test whether it has been met.
Next, you will distinguish the responsibilities of information architects, cloud architects, data engineers, and information-governance specialists. The requirements brief you developed here will make those role boundaries much clearer: each role contributes differently to turning a validated information need into a working enterprise solution.