Hello! Welcome to the next lesson in our journey through machine learning statistics.
In our previous session, we played the role of a data science detective, using residual plots to diagnose when a linear regression model's assumptions are violated. We saw that when the underlying data has a non-linear pattern, a simple straight-line model is fundamentally inadequate.
This begs the question: if a simple model is a problem, why not just use a highly complex one that can capture any pattern? Today, we will explore the answer to that question by diving into one of the most important and foundational concepts in all of machine learning.
Our goal is to explain the bias-variance tradeoff in the context of model complexity. Understanding this concept is crucial for your goal of justifying why a certain modeling approach is correct. It governs the entire process of model selection and tuning.
The Core Tension: Underfitting vs. Overfitting
Imagine trying to predict a mouse's height from its weight. The true relationship is probably a curve—mice get taller as they get heavier, but only up to a point.
- A Simple Model (High Bias): If we try to fit a straight line to this curved data, our model is too simple. It can't capture the true relationship, no matter how much data we give it. This failure to capture the underlying pattern is called bias. A high-bias model underfits the data.
- A Complex Model (High Variance): Now, imagine we use an extremely "flexible" or "squiggly" line that perfectly weaves through every single data point in our training set. This model might have zero error on the data it was trained on, but it has likely memorized the random noise as well as the signal. When we show it new, unseen data, it will probably perform very poorly because it's too sensitive to the specific training set it saw. This sensitivity to the training data is called variance. A high-variance model overfits the data.
To build a solid intuition for this, let's watch a classic explanation from StatQuest.
Machine Learning Fundamentals: Bias and Variance
The video 'Machine Learning Fundamentals: Bias and Variance' by StatQuest with Josh Starmer provides an excellent and intuitive visual introduction to these concepts.
Watch the video from the beginning up to 06:06. Pay close attention to how the 'straight line' model illustrates bias and the 'squiggly line' model illustrates variance. Notice the difference in performance on the training set versus the testing set.
As the video shows, the goal isn't to have zero training error. The goal is to build a model that generalizes well to new, unseen data. This requires finding a "sweet spot" between a model that's too simple (high bias) and one that's too complex (high variance).
This is the essence of the bias-variance tradeoff.
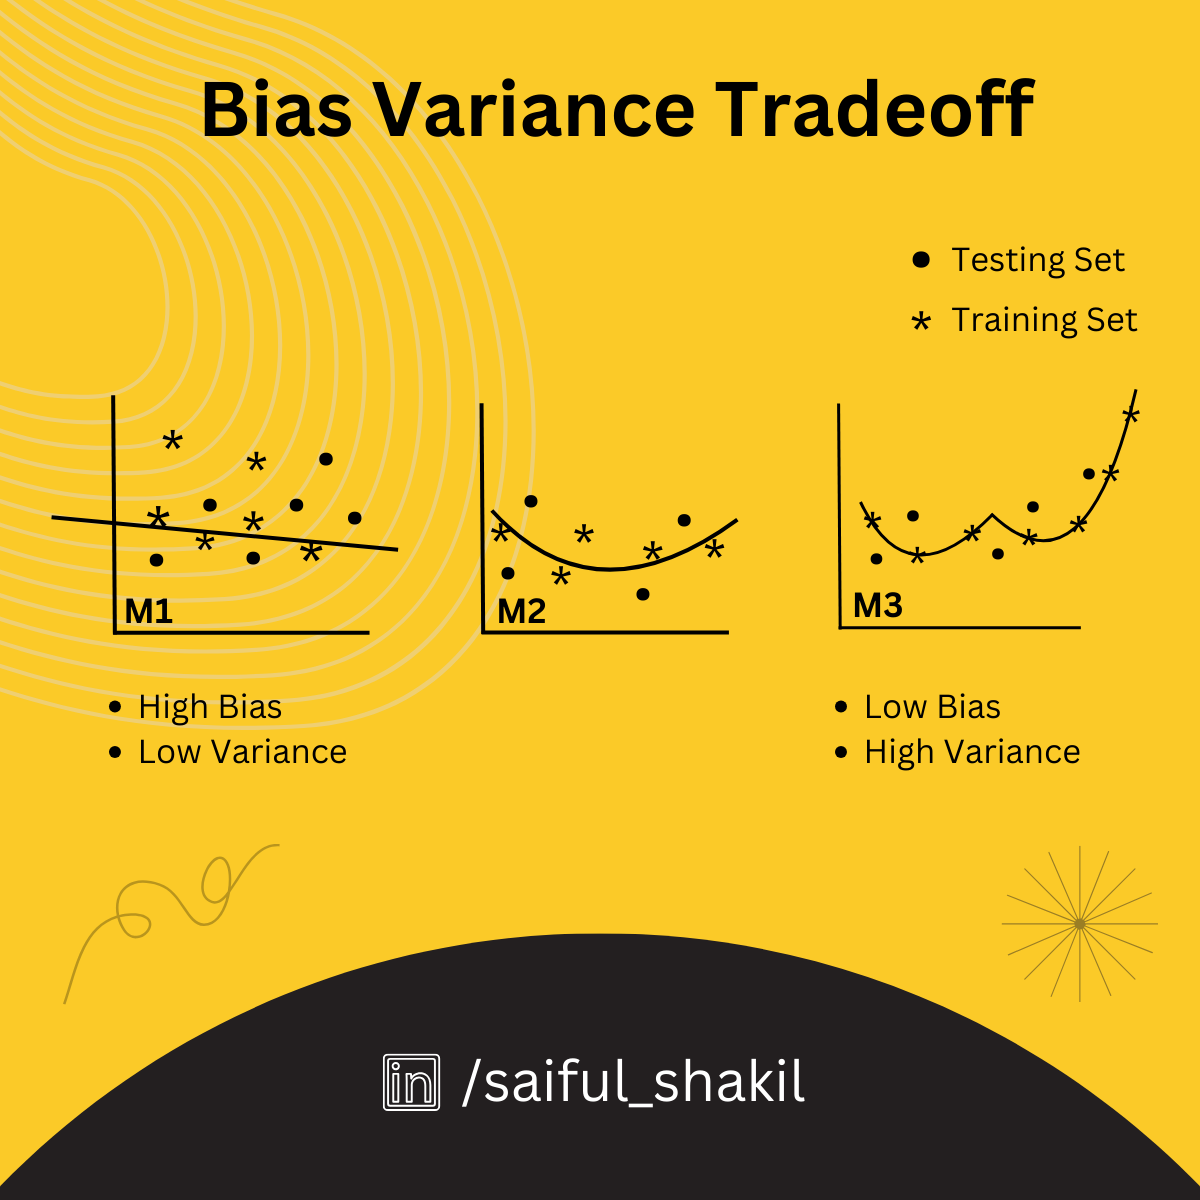
This image shows three models of increasing complexity. Model M1 (left) is too simple and underfits (high bias). Model M3 (right) is too complex and overfits the training data (high variance). Model M2 (center) strikes a good balance.
Decomposing a Model's Error
To move beyond intuition, we can mathematically formalize this concept. The total expected error of any machine learning model on unseen data can be decomposed into three components:
Let's break these down:
- Bias²: This term represents the error from the model's simplifying assumptions. It's a measure of how far off the average prediction is from the true value. A high-bias model is systematically wrong in the same way, like a broken clock that's always 10 minutes slow.
- Variance: This term represents the model's sensitivity to the specific training data. It measures how much the model's predictions would "jump around" if we trained it on different subsets of our data. A high-variance model gives very different predictions depending on the exact data it was trained on.
- Irreducible Error: This term is the inherent noise or randomness in the data itself. Even a "perfect" model can't eliminate this error. It represents the lower bound on the error that any model can achieve.
To see this decomposition explained in a more formal but still accessible way, let's turn to a lecture from Stanford University.
Statistical Learning: 2.3 Model Selection and Bias Variance Tradeoff
This clip from Stanford Online's 'Statistical Learning' course, presented by one of the authors of the foundational textbook, formally introduces the error decomposition and visualizes the tradeoff.
Watch the entire clip (00:00 to 10:04). The first part (until 05:49) reinforces the idea of training vs. test error. The second part (from 05:49) introduces the mathematical decomposition and the U-shaped test error curve, which is a critical visual to understand.
A great visual analogy for bias and variance is a target (bulls-eye).

*This cheat sheet provides a compact summary. The target diagrams on the top left are especially useful:
- Low Bias, Low Variance (Top-Left): Predictions are accurate and consistent (the ideal).
- Low Bias, High Variance (Top-Right): Predictions are accurate on average but scattered (overfitting).
- High Bias, Low Variance (Bottom-Left): Predictions are consistent but systematically wrong (underfitting).
- High Bias, High Variance (Bottom-Right): Predictions are inaccurate and inconsistent (the worst case).*
The Tradeoff Curve and Model Complexity
As the Stanford video showed, bias and variance typically have an inverse relationship with respect to model complexity.
-
As you increase model complexity (e.g., using a higher-degree polynomial, a deeper decision tree):
- Bias decreases (the model can fit more intricate patterns).
- Variance increases (the model becomes more likely to fit the noise in the training data).
-
As you decrease model complexity:
- Bias increases (the model's assumptions become too simple).
- Variance decreases (the model is less sensitive to the training data).
This leads to the characteristic U-shaped curve for the total error on the test set. Our goal as machine learning engineers is to find the level of complexity at the bottom of that "U".
This graph shows how bias decreases and variance increases as model complexity grows. The total error on unseen data (the red curve) is minimized at an optimal point of complexity, balancing the two.
Seeing the Tradeoff in Practice with Code
Let's make this concrete. A common way to increase the complexity of a linear model is to use Polynomial Regression. Instead of just fitting a line , we can fit a curve by adding polynomial terms: . The degree of the polynomial is our knob for controlling model complexity.
The following code demonstrates this perfectly. It tries to fit a noisy cosine wave using polynomials of different degrees.
import numpy as np
import matplotlib.pyplot as plt
from sklearn.pipeline import Pipeline
from sklearn.preprocessing import PolynomialFeatures
from sklearn.linear_model import LinearRegression
from sklearn.metrics import mean_squared_error

# 1. Generate synthetic data (True function: Cosine)
np.random.seed(0)
n_samples = 30
degrees = [1, 4, 15] # Linear (Simple), Optimal, High Degree (Complex)

X = np.sort(np.random.rand(n_samples))
y = np.cos(1.5 * np.pi * X) + np.random.randn(n_samples) * 0.1 # Add noise

X_test = np.linspace(0, 1, 100)
plt.figure(figsize=(14, 5))

for i, degree in enumerate(degrees):
    ax = plt.subplot(1, 3, i + 1)

    # Create pipeline: Polynomial Features -> Linear Regression
    polynomial_features = PolynomialFeatures(degree=degree, include_bias=False)
    linear_regression = LinearRegression()
    pipeline = Pipeline([
        ("polynomial_features", polynomial_features),
        ("linear_regression", linear_regression),
    ])

    # Train model
    pipeline.fit(X[:, np.newaxis], y)

    # Evaluate
    y_pred = pipeline.predict(X_test[:, np.newaxis])
    train_score = mean_squared_error(y, pipeline.predict(X[:, np.newaxis]))

    # Plotting
    plt.plot(X_test, y_pred, label=f"Model (Degree {degree})")
    plt.plot(X_test, np.cos(1.5 * np.pi * X_test), label="True Function", linestyle="--")
    plt.scatter(X, y, edgecolor='b', s=20, label="Training Data")
    plt.title(f"Degree {degree}\nMSE = {train_score:.2e}")
    plt.ylim(-1.5, 1.5)
    plt.legend(loc="best")

plt.show()
When you run this code, you'll see three plots:
- Degree 1 (High Bias): A straight line that completely fails to capture the cosine curve. It has underfit the data.
- Degree 4 (Good Balance): A curve that closely follows the true function, ignoring most of the random noise. This is near the "sweet spot".
- Degree 15 (High Variance): A wild curve that wiggles violently to pass through almost every single training point. It has perfectly learned the training data, including the noise. This is severe overfitting.
This practical example encapsulates the entire tradeoff in one visual. To explore this further, I recommend reading through the following Kaggle notebook which not only visualizes this but also shows how to calculate the bias and variance values.
Mastering Bias-Variance Tradeoff
The Kaggle notebook 'Mastering Bias-Variance Tradeoff' provides a fantastic hands-on demonstration. It walks through generating data, fitting models of varying complexity, and plotting the resulting bias and variance.
Read through the notebook, focusing on these sections: '9. Diving Deep into Code Examples - Generating Data': Understand how the synthetic data is created. '12. Testing with 2nd Degree Polynomial' through '15. Testing with 8th Degree Polynomial': Observe how the model's fit changes as the polynomial degree increases. '16. Ploting Metrics': This is the key part. Analyze the final plots that show how MSE, Bias, and Variance change as a function of model complexity (the polynomial degree). This brings everything together visually.
Test your understanding!
A data scientist on your team trains a very complex Gradient Boosting model. They proudly report that the model has a Mean Squared Error (MSE) of just 2.5 on the training data. However, when you deploy the model, the MSE on new, unseen data is 45.8.
- What is the most likely problem here: high bias or high variance?
- Based on this diagnosis, what are two concrete actions you could suggest to improve the model's real-world performance?
Show answer
-
This is a classic case of high variance (overfitting). The massive gap between the training error (2.5) and the test error (45.8) shows that the model learned the training data's noise perfectly but failed to generalize to new data.
-
Here are a few possible suggestions:
- Get more training data: This is often the most effective way to combat high variance. More data helps the model learn the true signal instead of the noise.
- Reduce model complexity: For a Gradient Boosting model, this could mean reducing the number of trees, limiting the depth of each tree, or increasing the minimum number of samples required to make a split.
- Introduce regularization: Add a penalty for model complexity. This explicitly forces the model to be simpler and is a core technique for preventing overfitting.
Conclusion
Today we've unpacked one of the most essential concepts in machine learning. The bias-variance tradeoff is the central challenge you will face in almost every modeling project. Your ability to diagnose whether your model is suffering from high bias or high variance and knowing how to correct it is a critical skill.
Key Takeaways:
- Bias is error from a model being too simple (underfitting). It's characterized by high error on both training and test data.
- Variance is error from a model being too complex and sensitive to noise (overfitting). It's characterized by very low error on training data but high error on test data.
- A model's total error is a sum of its Bias², Variance, and Irreducible Error.
- Increasing model complexity generally decreases bias but increases variance. The goal is to find the optimal complexity that minimizes the total error on unseen data.
Preview of the Next Lesson:
In our exercise, one of the key solutions for fixing a high-variance model was regularization. This is not just a theoretical idea; it's a powerful and practical technique. In our next lesson, we will dive into two of the most common types of regularization for linear models: Ridge (L2) and Lasso (L1) regularization. You'll learn how these methods mathematically penalize complexity to help us find that "sweet spot" in the bias-variance tradeoff.