Hello! Let's dive into our next lesson.
In our last session, we established the core mechanics of logistic regression. You learned why linear regression falls short for classification tasks and how the sigmoid function brilliantly transforms the output of a linear equation into a valid probability between 0 and 1. We saw that the model calculates a score and then plugs it into to get a prediction.
Today, we'll answer a crucial follow-up question: what do the learned weights (, or as they're often called in statistics) actually mean? This lesson is central to your goal of being able to explain and justify your models. By the end of this hour, you will be able to interpret logistic regression coefficients in terms of log-odds ratios, a skill that lets you precisely describe how each feature influences the model's prediction.
From Probability to a Linear Relationship
As we discussed, the relationship between a feature and the final probability is not linear; it's an S-shaped curve. This makes interpreting the coefficient tricky. We can't say "a one-unit increase in adds to the probability."
To find a linear relationship that we can interpret, we need to transform the y-axis. This involves two concepts you may have heard of but might not have used much in practice: odds and log-odds.
Let's build a solid foundation for these terms.
Odds and Log(Odds), Clearly Explained!!!
To start, let's get a clear and intuitive understanding of odds and log-odds. This StatQuest video by Josh Starmer is excellent for this. It explains the concepts from the ground up, which is essential for everything that follows in this lesson.
Please watch the entire video (about 10 minutes). It will cover: The definition of odds and how they differ from probability. How odds are calculated from probabilities. The motivation for using the logarithm of the odds (log-odds) to create a symmetric scale. The logit function, which is the name for this transformation.
As the video explained, we have a chain of transformations:
- Probability (P): The chance of an event happening, ranging from 0 to 1.
- Odds: The ratio of the probability of an event happening to it not happening. Calculated as , it ranges from 0 to .
- Log-Odds: The natural logarithm of the odds, . This transformation is key because it maps probabilities onto an unbounded, symmetric scale from to , just like the output of a linear model. This log-odds function is also known as the logit function.
The Logit Link: Connecting to the Linear Model
Now for the "aha!" moment. Let's revisit the logistic regression equation from last lesson and do a little algebra.
We started with:
where .
If we rearrange this equation to solve for , we find:
This reveals something profound: logistic regression is a linear model for the log-odds of the outcome.
The S-shaped curve we see when plotting probabilities becomes a straight line when we plot the log-odds instead. This is why we can use a linear equation () to model a non-linear probability.
This image perfectly illustrates the transformation.
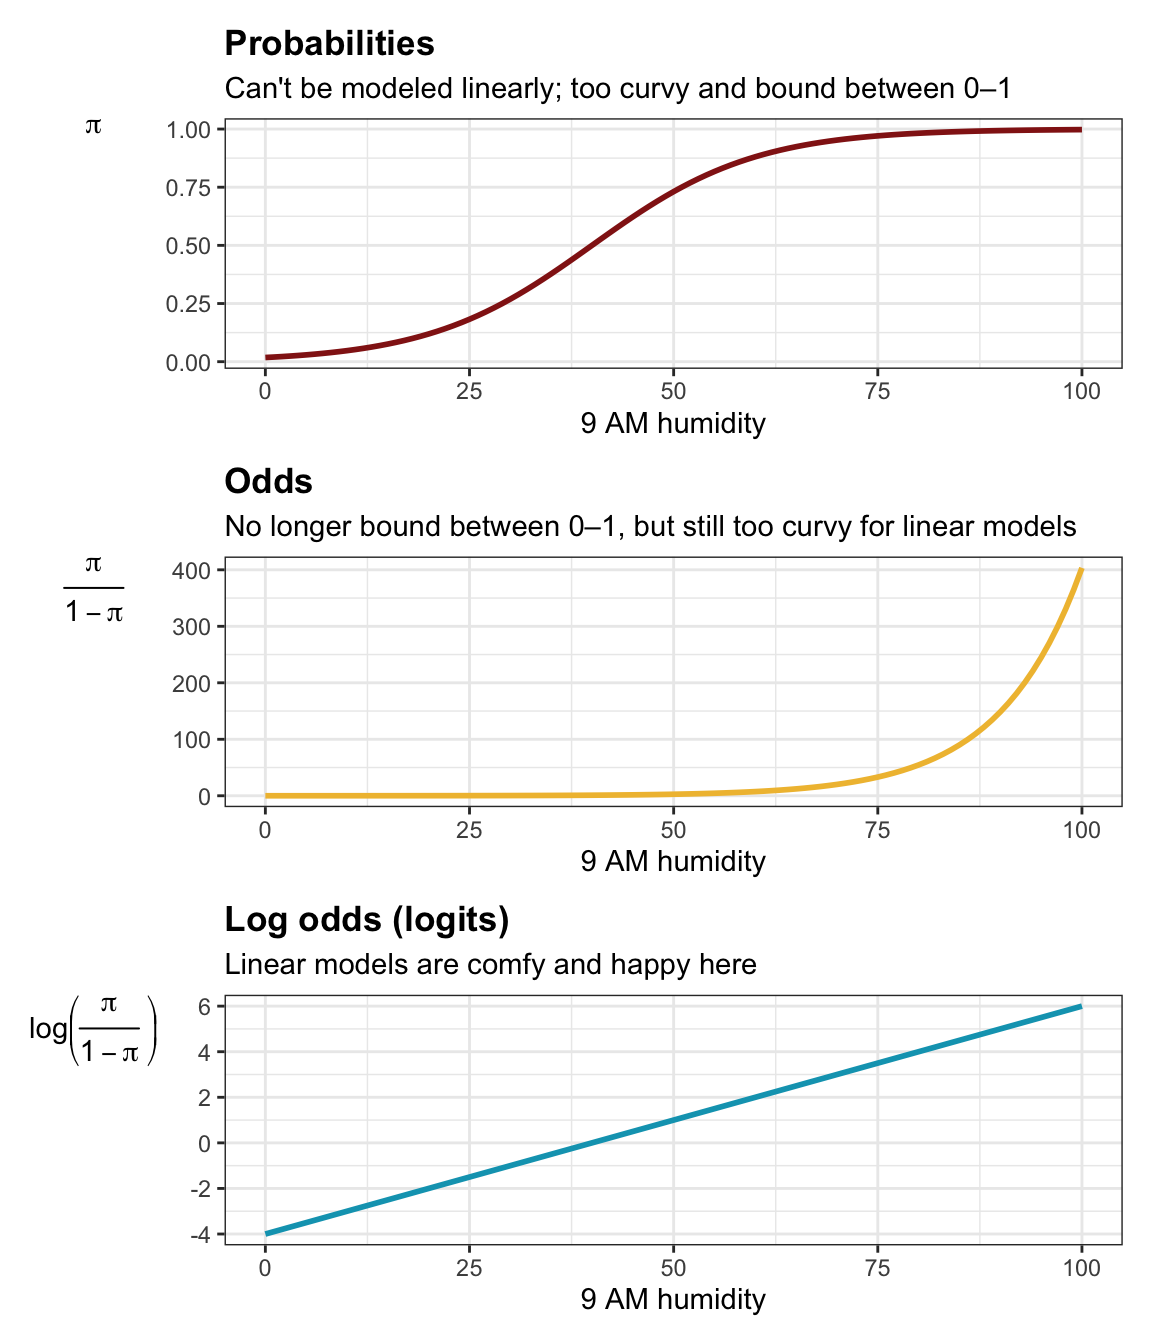
So, a one-unit increase in a feature results in an increase of in the log-odds of the outcome. This is mathematically correct, but "log-odds" are not very intuitive to explain. We need one more step to make our interpretation practical.
Interpreting Coefficients as Odds Ratios
Since the model is linear in the log-odds, we can compare the log-odds for an observation with feature value to one with feature value .
The change in log-odds is:
Using the logarithm rule , we get:
To get rid of the log, we exponentiate both sides:
This final expression, , is the odds ratio. It tells us how the odds of the outcome are multiplied when the feature increases by one unit. This is the most common way to interpret logistic regression coefficients.
- If , then , and a one-unit increase in increases the odds.
- If , then , and a one-unit increase in decreases the odds.
- If , then , and the feature has no effect on the odds.
Let's see this in action with some clear examples.
Logistic Regression Details Pt1: Coefficients
This StatQuest video walks through the interpretation of coefficients for both continuous and categorical variables, drawing parallels to the linear models you're already familiar with.
Watch the video from 02:47 to 18:41. The first part (until 10:36) covers continuous predictors, and the second part covers categorical predictors. Pay close attention to how the interpretation is phrased in each case.
To solidify this, let's look at a textual explanation and a concrete example.
Interpretation of Logistic Regression Coefficients
The book 'Interpretable Machine Learning' provides a concise derivation of the odds ratio and clear guidelines for interpretation. This will reinforce the math we just covered.
Read the sections 'Interpretation' and 'Example'. Focus on how the odds ratio exp(β_j) is derived and how the interpretations are phrased for both numerical and categorical features in the penguin example.
Summary of Interpretation Rules:
- For a continuous feature: "A one-unit increase in [feature name] is associated with the odds of [outcome = 1] being multiplied by a factor of , holding all other features constant."
- If , you can also say the odds increase by 15%.
- If , you can also say the odds decrease by 20%.
- For a categorical feature: "The odds of [outcome = 1] for [category name] are times the odds for the [reference category], holding all other features constant."
Now, let's test your understanding with a practical exercise.
Test your understanding!
A logistic regression model was trained to predict the probability of a customer churning (i.e., churn=1). The model produced the following coefficients:
| Feature | Coefficient () |
|---|---|
| (Intercept) | -1.5 |
monthly_charges |
0.03 |
is_senior_citizen (1=Yes, 0=No) |
0.4 |
- Calculate the odds ratio for
monthly_charges. - Interpret this odds ratio in a sentence.
- Interpret the coefficient for
is_senior_citizenin a sentence.
(You'll need a calculator for ).
Show answer
-
Odds Ratio for
monthly_charges: -
Interpretation: "For each additional dollar in monthly charges, the odds of a customer churning increase by about 3.05% (are multiplied by 1.0305), holding other factors constant."
-
Interpretation for
is_senior_citizen:
First, calculate the odds ratio: .
The interpretation is: "The odds of churning for a senior citizen are about 1.49 times (or 49% higher than) the odds of churning for a non-senior citizen, holding other factors constant."
Conclusion
Fantastic work! This lesson took you deep into the heart of interpreting logistic regression, a cornerstone of explainable machine learning. You've moved beyond simply generating a prediction to understanding how the model arrives at that prediction.
Key Takeaways:
- Logistic regression models a linear relationship with the log-odds of the outcome, not the probability itself.
- The log-odds are also known as the logit function: .
- A coefficient represents the change in the log-odds for a one-unit change in feature .
- For a more intuitive interpretation, we calculate the odds ratio by exponentiating the coefficient: .
- This odds ratio tells us the multiplicative factor by which the odds of the outcome change for a one-unit increase in the feature.
Preview of the Next Lesson:
We've mastered binary (two-class) classification. But what if we need to classify an outcome into three or more categories, like identifying a handwritten digit (0-9) or classifying news articles into topics (sports, politics, technology)? In our next lesson, you will learn how to extend logistic regression to multi-class problems using the softmax function. This will open up a much wider range of classification problems for you to solve.