Hello! Welcome back to our course.
In our previous lessons, we explored logistic regression for classification and learned how to evaluate its performance using tools like the confusion matrix, ROC curves, and AUC. These methods are fundamental to understanding how well a model distinguishes between classes.
Today, we're going to introduce a different, yet incredibly powerful, classification algorithm: the Support Vector Machine (SVM). While logistic regression models the probability of a class, an SVM takes a more geometric approach. It tries to find the best possible "decision boundary" that separates our data points.
Your learning outcome for this lesson is to explain the intuition behind Support Vector Machines (SVMs) and the concept of margin maximization. We'll focus on building a strong conceptual understanding of how SVMs work, which is crucial for knowing when and why to use them.
Part 1: The Core Idea - Maximal Margin Classification
Imagine you have a dataset with two classes that are clearly separable. You could draw many different lines (or "hyperplanes") to separate them. But which one is the best?
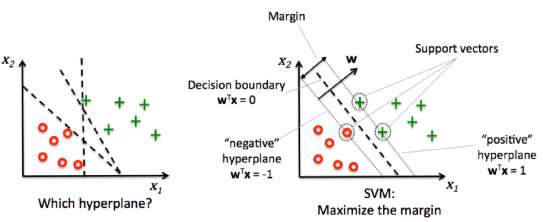
The core intuition of an SVM is to choose the hyperplane that is as far as possible from the nearest data points of both classes. This is called margin maximization.
Think of it like this: you're a construction company tasked with building the widest possible straight highway between two cities (the two classes), where the buildings are your data points. The edges of your highway are determined by the buildings closest to the road. These critical buildings are the support vectors because they "support" or define the position of your highway. The width of the highway is the margin. An SVM aims to make this margin as wide as possible.
The line running down the middle of this highway is our decision boundary, called the hyperplane.
Let's watch a video that brings this concept to life.
Support Vector Machines Part 1 (of 3): Main Ideas!!!
The StatQuest video 'Support Vector Machines Part 1: Main Ideas!!!' provides an excellent visual introduction to this core concept.
Watch from 01:41 to 03:39 to see the idea of the maximal margin explained. Then, skip ahead and watch from 08:04 to 10:15, which visualizes how this decision boundary generalizes from a point (1D) to a line (2D), a plane (3D), and finally a hyperplane in higher dimensions.
This idealized version of finding the widest possible margin that perfectly separates the data is called a Hard Margin Classifier or a Maximal Margin Classifier. It's defined by three key terms:
- Hyperplane: The decision boundary (a line in 2D, a plane in 3D).
- Support Vectors: The data points closest to the hyperplane that dictate its position and orientation.
- Margin: The distance between the hyperplane and the support vectors. SVMs work by maximizing this.
Part 2: Dealing with Reality - The Soft Margin
The hard margin approach works beautifully for perfectly clean, linearly separable data. But real-world data is rarely so neat. What happens if there are outliers, or the classes overlap slightly?
A hard margin classifier is extremely sensitive to outliers. A single outlier can dramatically change the hyperplane and result in a much smaller margin, leading to a model that doesn't generalize well. This is an example of the bias-variance tradeoff: the hard margin model has high variance because it's so sensitive to the specific training data.
To create a more robust model, we can relax the rule that every data point must be outside the margin. This is the idea behind a Soft Margin Classifier.
Support Vector Machines Part 1 (of 3): Main Ideas!!!
Let's continue with the StatQuest video to see how allowing for some errors can lead to a better overall model.
Watch from 04:27 to 08:04. This section explains why we might want to allow misclassifications and introduces the concepts of a 'soft margin' and 'support vectors' in this more flexible context.
A soft margin classifier allows some data points to be on the wrong side of the margin, or even on the wrong side of the hyperplane. It makes a tradeoff: it accepts a few errors on the training data in exchange for a wider, more stable margin that will likely perform better on new, unseen data.
How do we control this tradeoff? We use a hyperparameter, typically denoted as C.
Support Vector Machines (SVM): An Intuitive Explanation
The article 'Support Vector Machines (SVM): An Intuitive Explanation' gives a great breakdown of how the C parameter works.
Read the section 'Regularization and Soft Margin SVM'. Focus on understanding the role of the hyperparameter C and how it controls the bias-variance trade-off.
To summarize the role of C:
Cis the regularization parameter that controls the penalty for misclassification.- High
C: Imposes a high penalty for misclassified points. The SVM will try to minimize errors, resulting in a narrower margin. This can lead to overfitting (high variance). - Low
C: Imposes a low penalty. The SVM is more tolerant of errors, allowing it to focus on finding a wider margin. This can lead to underfitting (high bias).
Choosing the right value for C is key to building a good SVM model and is usually done using techniques like cross-validation.
Test your understanding!
You are building an SVM model on a dataset that is known to be very noisy, with many potential outliers and overlapping class boundaries. To get a model that generalizes well, would you start by trying a high value or a low value for the C parameter? Why?
Show answer
You would start by trying a low value for C.
A low C value makes the model more tolerant of misclassifications. In a noisy dataset, many points might be "on the wrong side" due to noise, not because they represent the true decision boundary. A low C allows the SVM to ignore these outliers and focus on the bigger picture, creating a wider, more robust margin that is less influenced by the noise. This corresponds to a model with higher bias but lower variance.
Part 3: Unleashing the Power of SVMs - The Kernel Trick
So far, we've only discussed linear boundaries. But what if the data is not linearly separable at all? Imagine one class forming a circle of points inside a ring of points from the other class. No straight line can separate them.
This is where SVMs truly shine, using a concept called the kernel trick.
The intuition is simple: if we can't separate the data in its current dimension, we can project it into a higher dimension where it becomes linearly separable.
Support Vector Machines Part 1 (of 3): Main Ideas!!!
The final part of the StatQuest video explains this mind-bending—yet intuitive—idea.
Watch from 11:44 to 19:41. Focus on the core concept: transforming data into a higher dimension to make it separable. Pay attention to the explanation of the 'kernel trick' itself—that we don't actually have to do the transformation.
The "trick" in the kernel trick is that we don't need to perform the computationally expensive step of actually creating these new dimensions. A kernel function allows us to calculate the dot products (which represent the relationships) between the data points as if they were in the higher-dimensional space.
This allows SVMs to create incredibly complex, non-linear decision boundaries efficiently. Common kernels include:
- Polynomial Kernel: Creates polynomial decision boundaries.
- Radial Basis Function (RBF) Kernel: Creates complex, localized boundaries. It is one of the most popular and powerful kernels.
A Glimpse Under the Hood
To tie these ideas together, let's briefly look at what the SVM algorithm is trying to optimize. You don't need to memorize the math, but seeing the objective function can clarify the concepts we've discussed.
The SVM is solving an optimization problem with two competing goals:
- Maximize the margin. Mathematically, this is equivalent to minimizing
||w||², wherewis the vector perpendicular to the hyperplane. A smallerwmeans a larger margin. - Minimize the number of margin violations. This is the sum of the errors (
ζᵢ, or "slack variables") for each point that falls inside the margin or on the wrong side.
The final objective function looks like this:
This equation perfectly captures the tradeoff:
- The first term (
||w||²) pushes for a larger margin. - The second term (
C * Σζᵢ) pushes for fewer misclassifications. - The hyperparameter
Cis the knob that balances these two competing goals.
This provides a concrete mathematical basis for the intuitive ideas of margin maximization and the soft margin tradeoff.
Conclusion
You now have a solid intuition for one of the most elegant and powerful classifiers in machine learning. Unlike logistic regression, which thinks in terms of probabilities, SVMs think in terms of geometric separation.
Key Takeaways:
- Support Vector Machines (SVMs) aim to find the optimal hyperplane that best separates classes.
- The core principle is margin maximization: finding the hyperplane that creates the widest possible "street" between the classes.
- Support vectors are the critical data points lying on the edge of the margin that define the hyperplane.
- Soft margins are used for real-world data, allowing some misclassifications to achieve a more robust, generalizable model. The
Cparameter controls this bias-variance tradeoff. - The kernel trick is the key to applying SVMs to non-linear problems by implicitly projecting data into a higher dimension where it becomes linearly separable.
Preview of the Next Lesson:
In our next lesson, we will tackle a common practical challenge in classification: class imbalance. We'll learn how to diagnose when our dataset has a skewed distribution of classes and apply techniques like resampling and class weighting to ensure our models learn effectively. You'll see how the C parameter in SVMs can be adjusted to directly address this problem, providing a nice link back to today's topic.