Hello! Last lesson, you used the quadratic formula to find where a quadratic model equals zero. Now the question changes: which input makes the output as large or as small as possible? In this lesson, you will locate that input, calculate the corresponding maximum or minimum, and check whether the result makes sense in the situation being modelled.
The vertex answers two questions
The graph of a quadratic function is a parabola. Its turning point, called the vertex, has two coordinates: the input at which the turn occurs and the output at that input. If the parabola opens upward, the vertex is its minimum; if it opens downward, the vertex is its maximum.
For a function written as
the input at the vertex is
Substituting this input into the function gives the output: . Notice that does not appear in the formula for the input at the vertex, although it does affect the output.
Why does the sign of tell us whether the vertex is a maximum or minimum? Completing the square rewrites the function as
The squared expression is smallest when it equals zero, at . If , moving away from that input increases the output, giving a minimum. If , moving away decreases the output, giving a maximum. You can use the vertex formula without completing the square each time, but this form explains why it works—even when the parabola has no real roots.
The vertex therefore answers two distinct questions. “When or at what setting is the maximum reached?” asks for the input. “What is the maximum value?” asks for the output. In coursework, both usually need units and a sentence of interpretation.
Maximising an area with limited fencing
Suppose 80 feet of fencing will enclose three sides of a rectangular garden; an existing boundary forms the fourth side. Let feet be the length of each of the two sides perpendicular to that boundary. The remaining fenced side has length , so the area is
Before calculating, the model already tells us something. Very short perpendicular sides give little area; sides approaching 40 feet leave almost no fencing for the third side. An area maximum somewhere between those extremes is plausible.
Applications With Quadratic Functions | College Algebra
Read Lumen Learning’s worked garden example to see how a physical constraint becomes a quadratic area model, and how its vertex gives dimensions rather than just a number.
In “Module 8: Quadratic Functions,” under “Example: Finding the Maximum Value of a Quadratic Function,” read the garden example. Start at the description of the 80 feet of fencing and stop after the sentence giving all three fenced-side lengths. Focus on why only three sides use the new fencing, which coefficient is a, and what each coordinate of the vertex means.
Here and . Since , the vertex gives a maximum:
The model predicts a maximum area of 800 square feet when the two perpendicular sides are 20 feet each. The third fenced side must be feet. Stating only “20” would leave both the requested area and one of the garden dimensions unanswered.
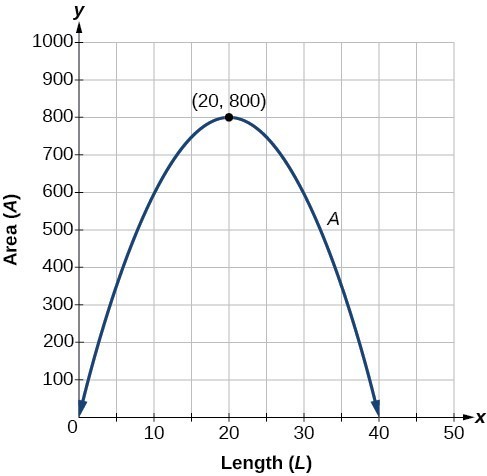
The graph also invites a domain check. For an actual rectangular enclosure, both and must be positive, so . The drawn parabola is a mathematical curve, but only inputs in that interval describe usable gardens. Fortunately, lies within it.
A minimum uses the same method
Imagine a model for the mass of unwanted residue, in milligrams, after minutes of a treatment:
Here , so the parabola opens upward. Its vertex occurs at
Substitute to find the minimum residue:
According to the model, 3 minutes gives the minimum residue of 4 milligrams within the stated treatment interval. We can make the minimum especially visible by rewriting the same function as
Because a square cannot be negative, cannot fall below 4, and it reaches 4 when .
This is a model prediction, not a guarantee about every treatment. The calculation locates the lowest output according to the supplied quadratic relationship; judging how well that relationship matches observations is a separate task later in the module.
Check the permitted inputs before reporting an optimum
A vertex can lie outside the practical domain. Suppose a model predicts a performance score
but the available setting is restricted to . The parabola’s vertex is at , where the formula gives 50, but that setting is unavailable. Over the permitted interval the score is still rising, so its achievable maximum is at the endpoint , where .
This distinction matters whenever a model has limits. First locate the vertex, then check whether its input is allowed. For an interval with included endpoints, check those endpoints as well when deciding the greatest or least achievable output.
A height model offers another way to read the two vertex coordinates. Watch how the calculation identifies both the time of greatest height and the height itself.
Maximum and Minimum Value Word Problems - Quadratic Equations
Watch “Maximum and Minimum Value Word Problems - Quadratic Equations” by The Organic Chemistry Tutor for a height-versus-time example.
Watch maximum height, from the introduction of the ball’s height model through the calculated peak. Focus on why the coefficient of the squared term indicates a maximum, why the vertex input is measured in seconds, and why substituting that input gives a height in metres.
In that model, the calculation gives a peak at about 3.06 seconds and a height of about 145.92 metres. The first number tells you when; the second tells you how high. A graph of height against time shows how height changes—it is not a drawing of the ball’s physical path through space.
Conclusion
For , find the vertex input with , then calculate . A positive gives a minimum; a negative gives a maximum. To finish a practical problem, interpret both coordinates with units and confirm that the input lies in the model’s permitted domain.
Next, you will build an exponential model from an initial value and a constant percentage change—a different pattern of change from the quadratic curves studied here.