Welcome to the final lesson of our first module. In our previous discussions, we've built a powerful functional integral framework for statistical field theory. We started with the Landau-Ginzburg Hamiltonian, derived the Ornstein-Zernike propagator from Gaussian fluctuations, and most recently, established Wick's theorem. This theorem provides a complete recipe for calculating any correlation function in a non-interacting theory by reducing it to a combinatorial exercise of pairing up fields.
Today, we will put this machinery to work on the full interacting theory. We can no longer solve the functional integral exactly, so we must resort to perturbation theory, treating the quartic interaction term as a small correction to the solvable Gaussian model. As we compute the first-order correction to the two-point correlation function, you will see a series of algebraic terms emerge from applying Wick's theorem. While algebraically cumbersome, this expansion has a beautiful and intuitive graphical structure. Our goal is to translate these algebraic terms into a pictorial language—the language of Feynman diagrams. By the end of this lesson, you will be able to represent the first-order perturbative corrections using propagators and vertex factors, setting the stage for all future perturbative calculations.
Perturbation Theory for Correlation Functions
Let's begin with the full Landau-Ginzburg action, separated into its free and interacting parts:
where is the free or Gaussian action, and is the interaction term. The factor of is a convention that will simplify our results by cancelling combinatorial factors later on.
The -point correlation function in the interacting theory is given by the ratio of two functional integrals:
Since is assumed to be small, we can expand the term in a Taylor series:
Substituting this into the expression for the correlation function turns the problem into one of calculating expectation values in the free theory, which we denote by . These are precisely the Gaussian averages that Wick's theorem allows us to compute.
Let's apply this to the two-point function, , keeping terms up to first order in . The numerator (Num) and denominator (Den) become:
\begin{align*}
\text{Num} &= \int \mathcal{D}\phi , \phi(x_1)\phi(x_2) \left(1 - \frac{u}{4!} \int d^dy , \phi^4(y)\right) e^{-S_0} \
&= \langle \phi(x_1)\phi(x_2) \rangle_0 - \frac{u}{4!} \int d^dy , \langle \phi(x_1)\phi(x_2)\phi^4(y) \rangle_0 \
\text{Den} &= \int \mathcal{D}\phi , \left(1 - \frac{u}{4!} \int d^dy , \phi^4(y)\right) e^{-S_0} \
&= 1 - \frac{u}{4!} \int d^dy , \langle \phi^4(y) \rangle_0
\end{align*}
Note that we have normalized by to define the free-theory averages .
The full two-point function is the ratio . Using the approximation , we get:
Multiplying this out and keeping terms to gives:
This central result tells us that the first-order correction is determined by the difference between a six-point and a four-point Gaussian average. This difference has a special name: the connected correlation function.
Wick's Theorem and the Birth of Diagrams
Now we must evaluate the Gaussian averages using Wick's theorem. Let's represent the bare propagator by a simple line connecting points and .
1. The Four-Point Average
We need to calculate . Wick's theorem instructs us to sum over all pairings. There are ways to pair the four fields:
Diagrammatically, we represent the interaction vertex at point with a dot. The pairings correspond to lines originating and ending at this vertex. Since we have two propagators , we draw two loops. The three terms are topologically identical.
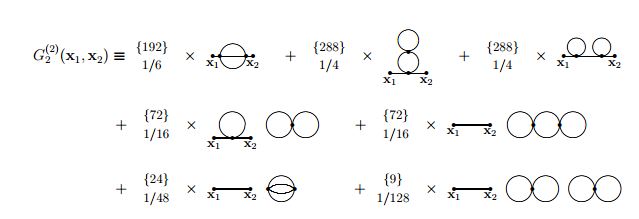
The term is the propagator from a point back to itself, forming a loop. The term is represented by two such loops emerging from the same interaction vertex .
2. The Six-Point Average
This is the expectation value of . Wick's theorem gives terms. We can group them by their graphical structure:
-
Type 1: Disconnected diagrams. We pair with and pair the four fields among themselves.
- The pairing of and gives one factor of .
- The remaining gives a factor of .
- The total contribution from these pairings is .
- Diagrammatically, this is a propagator from to that is completely separate from the double-loop diagram at vertex .
-
Type 2: Connected diagrams. We pair the "external" fields and with the "internal" fields at the interaction vertex . For example, pair with a , with another , and the remaining two 's with each other.
- This gives a product of propagators: .
- How many ways can we form this? There are 4 choices for which to pair with , 3 choices for which to pair with , and the last two 's have 1 way to be paired. This gives identical terms.
- The total contribution is .
- Diagrammatically, this corresponds to a line from to , a line from to , and a loop from back to itself. This is often called a "tadpole" diagram.
The Linked Cluster Theorem and Feynman Rules
Now, let's substitute these results back into our expression for the two-point function:
\begin{align*}
\langle \phi(x_1)\phi(x_2) \rangle &\approx G_0(x_1-x_2) - \frac{u}{4!} \int d^dy \left[ (3 G_0(x_1-x_2)G_0(0)^2 + 12 G_0(x_1-y)G_0(x_2-y)G_0(0)) - (G_0(x_1-x_2) \cdot 3 G_0(0)^2) \right] \
&= G_0(x_1-x_2) - \frac{12u}{24} \int d^dy , G_0(x_1-y)G_0(y-y)G_0(y-x_2) \
&= G_0(x_1-x_2) - \frac{u}{2} \int d^dy , G_0(x_1-y)G_0(0)G_0(y-x_2)
\end{align*}
Notice a remarkable cancellation: the disconnected part of the six-point function, , is exactly cancelled by the term involving . This is a general feature known as the Linked Cluster Theorem: in the perturbative expansion of any correlation function, all disconnected "vacuum bubble" diagrams are cancelled by the expansion of the denominator. We are left only with fully connected diagrams.
This process gives birth to the Feynman rules for our theory, a dictionary for translating diagrams into mathematical expressions.
The following resources provide a detailed derivation of these rules. The first text, from Luty, walks through the same calculation we just performed. The second, from Hong, shows a wide variety of diagrams that can be generated.
Correlation Functions and Diagrams
These notes by Markus Luty provide a very clear, step-by-step derivation of the perturbative expansion for the \phi^4 theory, which closely mirrors our discussion. It's an excellent resource to solidify your understanding of the algebra.
Start by reading the section "Weak Coupling Perturbation Theory" on page 11. Follow the expansion of the 2-point function in this part, which shows exactly how the disconnected terms cancel. Then, continue to the section where the author introduces the diagrammatic rules, connecting the algebra to the pictures. Pay close attention to the calculation of the combinatorial "symmetry factor" S.
Our calculation reveals the first-order correction to the propagator is given by the tadpole diagram. This correction represents a process where a particle propagates from to , interacts with the vacuum fluctuations at (the loop), and then propagates from to .
From this, we can summarize the first Feynman rules in position space for calculating connected correlation functions:
- Draw all topologically distinct, connected diagrams with the desired number of external points for a given order in .
- For each line (propagator) between points and , write a factor of .
- For each four-point vertex at position , write a factor of and integrate over its position .
- Multiply by an overall symmetry factor, which is a combinatorial number that accounts for the ways of forming the diagram from Wick contractions and the from the expansion. For our tadpole diagram, the factor is .
Higher-Order Corrections
This diagrammatic method is extremely powerful because it organizes a complicated perturbative expansion. To illustrate, let's consider the connected four-point function, .
- Zeroth-order (): The zeroth-order four-point function consists only of disconnected propagators, e.g., . Therefore, the connected part is zero.
- First-order (): The first non-zero contribution comes at order . We need to compute . Applying Wick's theorem, the only connected contribution comes from pairing each external field with one of the fields at the vertex .
- There are ways to do this.
- The resulting term is .
- The diagram is simply four lines emerging from the external points and meeting at a single interaction vertex .
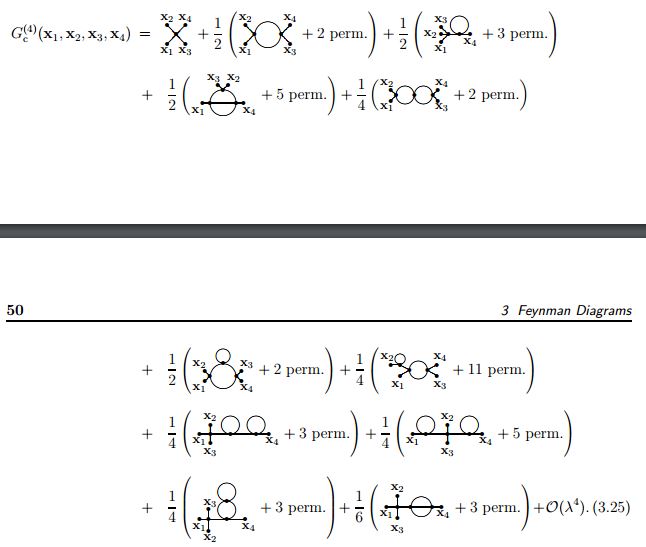
The following resource shows how these rules are used to construct more complex diagrams for higher-order corrections.
Quantum Fields & Condensed Matter Physics
This text provides further examples of perturbative expansions and their diagrammatic representations. It's useful for seeing the pattern and appreciating the organizational power of Feynman diagrams.
First, look at the section "PERTURBATIVE EXPANSION FOR THE TWO-POINT FUNCTION" starting on page 160. Skim through equations (3) and (4) to see the <span data-type="resource_reading_textrange" data-resource-subitem-id="b0a0f6e1" data-range-start="second term, the "tadpole" diagram" data-range-end="internal vertex.">tadpole diagram appear again. Then, browse the next section, "PERTURBATIVE EXPANSION FOR THE FOUR-POINT FUNCTION," on page 166. Focus on the diagrams shown. The tree-level diagram is the first-order correction we just discussed. The diagrams labeled "To one-loop order" are examples of second-order (O(u^2)) corrections, which involve two vertices and one or more internal loops.
Conclusion
In this lesson, we have bridged the gap between the algebraic formalism of Wick's theorem and the intuitive, powerful language of Feynman diagrams. By carrying out a first-order perturbative expansion for the interacting theory, we saw how diagrams naturally arise to represent the terms from Wick contractions.
Here are the key takeaways:
- Perturbation theory expands the interacting part of the action, , turning calculations in an interacting theory into sums of Gaussian averages in the free theory.
- The Linked Cluster Theorem ensures that only fully connected diagrams contribute to correlation functions; disconnected vacuum bubbles cancel out.
- Feynman diagrams provide a graphical representation of the terms in the perturbative expansion.
- We established the basic Feynman rules in position space: lines correspond to propagators (), vertices to coupling constants () and integrations (), and each diagram has a specific combinatorial symmetry factor.
This lesson concludes our foundational module on Landau-Ginzburg theory and functional integrals. You now have the complete toolset to analyze systems near a critical point using perturbation theory.
In our next module, we will shift our focus to systems with continuous symmetries. We will explore the profound consequences of spontaneous symmetry breaking, leading to the emergence of collective excitations known as Goldstone modes. We will begin by defining spontaneous symmetry breaking and analyzing the mean-field theory of the O(N) model, a generalization of the Ising model that will be central to our future discussions.