Hello! Welcome back to our course on ICT trading.
In our first lesson, we focused on identifying the fundamental building blocks of any chart: the swing highs and swing lows that form price legs. This skill is the "alphabet" of chart analysis.
Today, we'll start forming words and sentences. Our goal is to distinguish between bullish and bearish market structure. We will use the swing points you learned to identify to define the market's current trend. Understanding whether the market is in an uptrend, a downtrend, or consolidating is the first and most critical question a trader must answer before considering any trade.
Let's begin by defining the two primary market trends.
1. The Anatomy of an Uptrend: Bullish Market Structure
A bullish market structure, or an uptrend, is characterized by a clear pattern of expansion to the upside. This doesn't mean price moves in a straight line; rather, it moves in a series of waves.
The defining characteristic of a bullish structure is a sequence of:
- Higher Highs (HH): Each new significant swing high is formed at a price level higher than the previous significant swing high.
- Higher Lows (HL): Each pullback or retracement creates a significant swing low that is higher than the previous significant swing low.
This pattern signals that buyers are in control, consistently pushing the price to new heights and defending higher price levels on pullbacks.
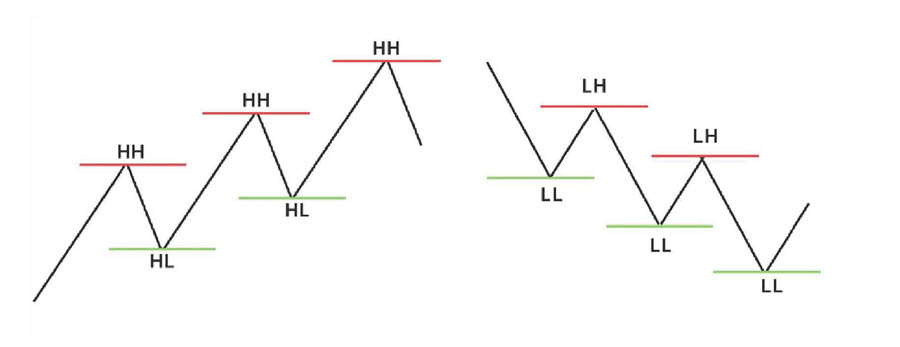
This image provides a clear, idealized diagram of a bullish market structure (left) with its series of Higher Highs (HH) and Higher Lows (HL), and a bearish structure (right).
For a more detailed textual definition, the following resource provides an excellent summary.
The article 'Market Structure Basics' from TradeZella offers a concise and clear explanation of what constitutes an uptrend in ICT terms.
Read the section titled 'Uptrend (Bullish Market Structure)'. Focus on how it describes the formation of higher highs and higher lows as an indication of buyer control.
2. The Anatomy of a Downtrend: Bearish Market Structure
Conversely, a bearish market structure, or a downtrend, is defined by a series of downward waves. It's the mirror image of a bullish structure.
The defining characteristics of a bearish structure are:
- Lower Lows (LL): Each new significant swing low is formed at a price level lower than the previous significant swing low.
- Lower Highs (LH): Each upward bounce or retracement creates a significant swing high that is lower than the previous significant swing high.
This pattern indicates that sellers are in control, driving the price down and failing to reclaim previous high points on bounces. Refer back to the right side of the image above for the idealized diagram.
Now, let's complement the previous reading with the definition of a downtrend.
Continuing with the 'Market Structure Basics' article, we'll now look at the definition of a downtrend.
Read the section titled 'Downtrend (Bearish Market Structure)'. Note the opposite logic: lower highs and lower lows indicating seller dominance.
3. Identifying Market Structure on a Live Chart
Theory is one thing, but identifying these patterns in the noise of a real chart is the key skill. The following video walks through clear examples of both bullish and bearish trends.
Understanding Market Structure For Trading
The video 'Understanding Market Structure For Trading' by TTrades provides excellent, straightforward examples of identifying these structures on a chart.
Please watch two segments from this video: Bullish Example (03:14 - 05:03): Observe how the presenter marks the sequence of higher highs and higher lows to confirm the uptrend. Bearish Example (05:03 - 06:34): Notice the same logic applied in reverse to identify the series of lower highs and lower lows in a downtrend.
Test your understanding!
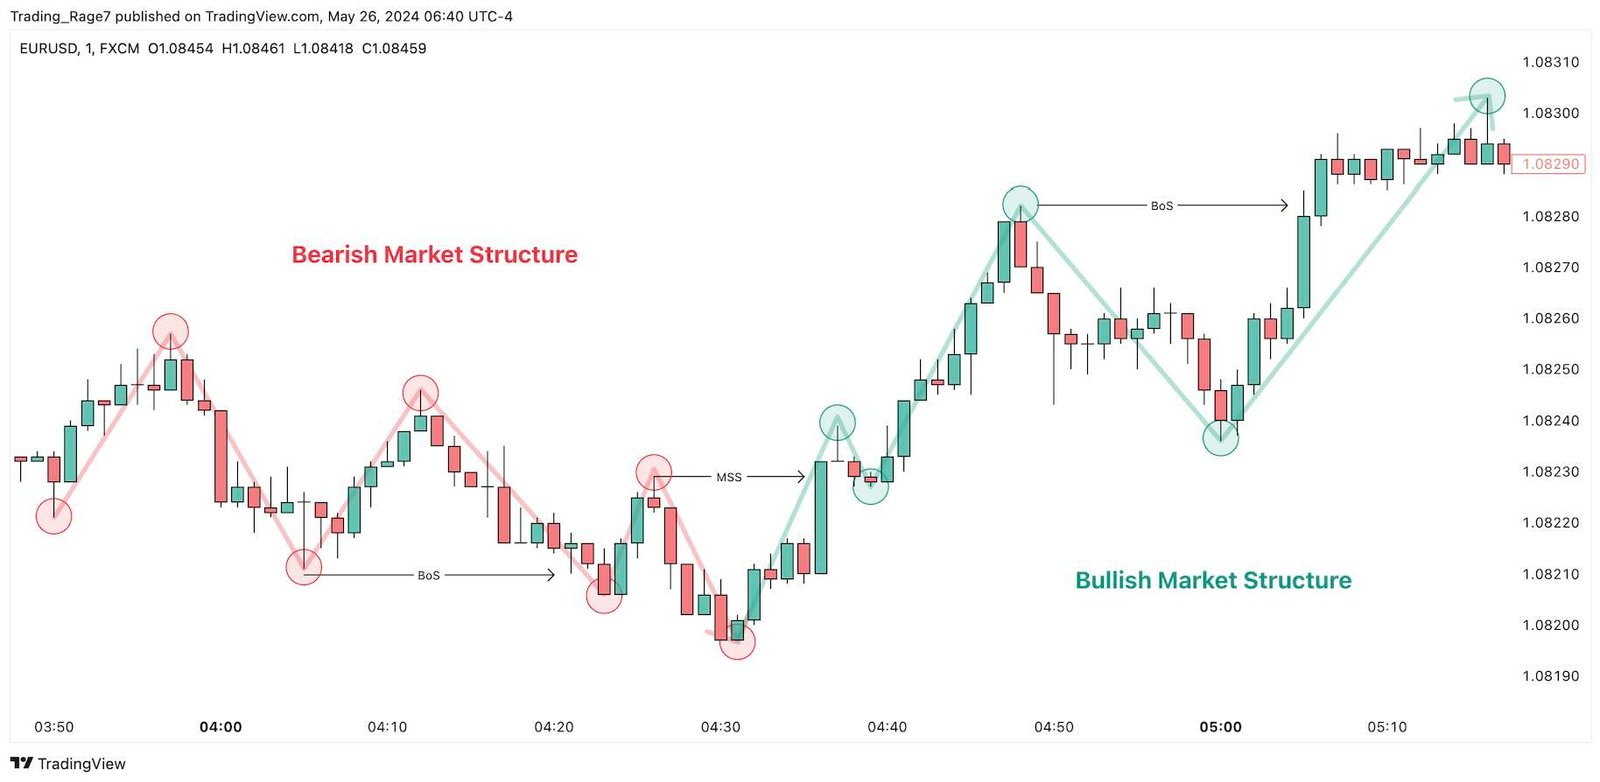
Look at the chart below. Focus on the section labeled "Bullish Market Structure." Can you trace the sequence of Higher Highs (HH) and Higher Lows (HL) that define this uptrend? Where does the last Higher Low form before price creates the final Higher High in this section?
Show answer
In the "Bullish Market Structure" section, you can see price makes a low, then a high. It then pulls back to form a Higher Low (HL). From that HL, it rallies to break the previous high, creating a Higher High (HH). This HH/HL pattern continues, confirming the bullish trend. The final HL before the "Market Structure Shift" is the last significant trough before price makes its ultimate peak in that bullish leg.
4. Beyond the Ideal: Internal vs. External Structure
The simple HH/HL and LL/LH patterns are the "ideal" structure. However, real charts are far more complex. Within a large upward price leg (from a major swing low to a major swing high), you will often see smaller, temporary bearish patterns forming during the pullback.
This brings us to a crucial ICT concept: the difference between External (or Major) Structure and Internal Structure.
- External Structure: This is the series of major swing highs and lows that define the overall, dominant trend. For example, the major Higher Highs and Higher Lows on a 4-hour chart.
- Internal Structure: This refers to the smaller price movements and minor swing points that form within a single leg of the external structure. For example, during a pullback in a 4H uptrend, the 15-minute chart might show a temporary pattern of lower lows and lower highs.
Distinguishing between the two is vital. A trader who mistakes a break of internal structure for a change in the overall trend will often be caught on the wrong side of the market. The main trend, defined by the external structure, remains valid as long as its key swing points are not broken.
This next video does an excellent job of explaining this distinction between the "ideal" textbook pattern and the "realistic" structure you will encounter daily.
Advanced Market Structure Course (Full Tutorial)
The 'Advanced Market Structure Course' by Smart Risk introduces the critical difference between the simple models and real-world price action, helping you differentiate between the main trend and minor pullbacks.
This is a key video for advancing your understanding. Watch from 01:47 to 03:25. This section introduces the 'ideal' uptrend and downtrend structures we've just discussed. Now, watch from 03:25 to 07:04. This is the most important part. Pay close attention to how the presenter defines major (external) highs and lows versus the internal structure that forms between them. Understand why the trend is still considered bullish even if price makes lower lows internally, as long as the major external low holds.
This concept is especially important for your goal of developing trading bots. An algorithm must be programmed with clear rules to distinguish between a minor pullback (a break of internal structure) and a true reversal of the larger trend (a break of external structure).
Conclusion
In this lesson, we moved from identifying individual swing points to interpreting the story they tell together. You now have a framework for reading the market's primary direction.
Key Takeaways:
- Bullish Market Structure is defined by a consistent series of Higher Highs (HH) and Higher Lows (HL).
- Bearish Market Structure is defined by a consistent series of Lower Lows (LL) and Lower Highs (LH).
- Real charts are complex. The External Structure (major swings) defines the overall trend, while the Internal Structure (minor swings) represents the price action within a single trend leg.
- A trend remains intact as long as its external structure is not broken. A break in internal structure is often just a pullback, not a reversal.
Preview for the Next Lesson:
Now that you can identify a trend, the next question is: "How do I know the trend is continuing?" In the next lesson, we will focus on the Break of Structure (BOS). This is the specific event that confirms a trend's continuation, happening when price breaks beyond a previous external swing high (in an uptrend) or swing low (in a downtrend).