Hello! Welcome to our next lesson on advanced ICT trade models.
In our last session on the Judas Swing, we explored how smart money engineers a false move at a session open to sweep liquidity before initiating the day's real trend. A key challenge is gaining conviction that the liquidity sweep is truly a false move and that a reversal is imminent.
Today, we address that challenge directly. As previewed, this lesson will introduce you to the Smart Money Technique (SMT) Divergence. The learning outcome is to recognize SMT divergence between correlated assets. You will learn to compare the price action of two related markets to spot subtle disagreements that often foreshadow a reversal, giving you a powerful confirmation tool for your trade ideas.
1. The Core Concept: When Correlated Assets Disagree
In financial markets, certain assets are expected to move in tandem due to their economic relationship. For example, the S&P 500 (ES) and the NASDAQ 100 (NQ) are both major US stock indices and typically trend in the same direction. When they don't, it signals an inefficiency—a "divergence" that smart money often creates and exploits.
SMT Divergence is the observation of this disagreement. It occurs when one asset confirms a price swing (e.g., makes a new high), while its correlated partner fails to do so. This failure indicates underlying strength or weakness and can alert you to a potential reversal.
To get a strong conceptual foundation, let's watch a video that explains this idea of a "leading" versus a "lagging" asset.
The Only SMT Divergence Video You'll Ever Need
The video 'The Only SMT Divergence Video You'll Ever Need' by TJR offers a very clear explanation of the logic behind SMT. This first segment introduces the concept and explains why this divergence is so significant.
Watch from 00:00:15 to 00:04:16. Focus on understanding the core idea: one asset's price action can tell you the 'future' of its correlated partner. Pay attention to the explanation of a 'leading' versus a 'lagging' index.
As the video explained, SMT divergence isn't just a random pattern; it's a footprint of institutional intent. When one asset fails to follow the other into a new high or low, it's often because smart money has already positioned itself for a reversal in that "stronger" or "weaker" asset.
2. Identifying Correlated Pairs
To spot SMT divergence, you first need to know which assets to compare. The relationship can be either positive (moving together) or negative (moving opposite to each other).
The following article provides a good overview of common correlated pairs across different markets.
SMT Divergence in ICT: How to Identify and Trade ...
The article 'SMT Divergence in ICT' from TradingFinder gives a structured breakdown of asset correlation. We'll use it to create a quick reference list.
Please read the section 'Positive and Negative Correlations in ICT SMT'. You don't need to study the charts in detail yet, just familiarize yourself with the pairs listed.
Based on the reading, here are the most common pairs you will use:
- Positively Correlated (move together):
- Indices: S&P 500 (ES or US500) & NASDAQ 100 (NQ or US100)
- Forex: EUR/USD & GBP/USD
- Commodities: Gold (XAU/USD) & Silver (XAG/USD)
- Negatively Correlated (move opposite):
- Forex/Index: EUR/USD & the US Dollar Index (DXY)
For the rest of this lesson, we will focus primarily on positively correlated assets, as they provide the most straightforward examples for learning to recognize the patterns.
3. The Patterns: Bullish and Bearish SMT
SMT divergence manifests in two primary forms: bullish (signaling a potential move up) and bearish (signaling a potential move down).
Bearish SMT Divergence
This occurs in an uptrend when one asset makes a higher high (HH), but its correlated partner fails to do so, instead creating a lower high (LH).
- What it looks like:
- Asset A takes out a previous swing high.
- Asset B approaches the corresponding swing high but fails to break it, then turns lower.
- Interpretation: The failure of Asset B to make a higher high shows underlying weakness. The higher high on Asset A is likely a final push to grab buy-side liquidity (a "stop hunt") before a reversal lower. The asset that made the lower high is considered the "smarter" one, leading the way down.

Bullish SMT Divergence
This occurs in a downtrend when one asset makes a lower low (LL), but its correlated partner fails to take out its corresponding low, instead creating a higher low (HL).
- What it looks like:
- Asset A takes out a previous swing low.
- Asset B approaches the corresponding swing low but respects it, then turns higher.
- Interpretation: The failure of Asset B to make a lower low shows underlying strength. The lower low on Asset A is likely a final push to grab sell-side liquidity before a reversal higher. Asset B, which held its low, is the "smarter" money.
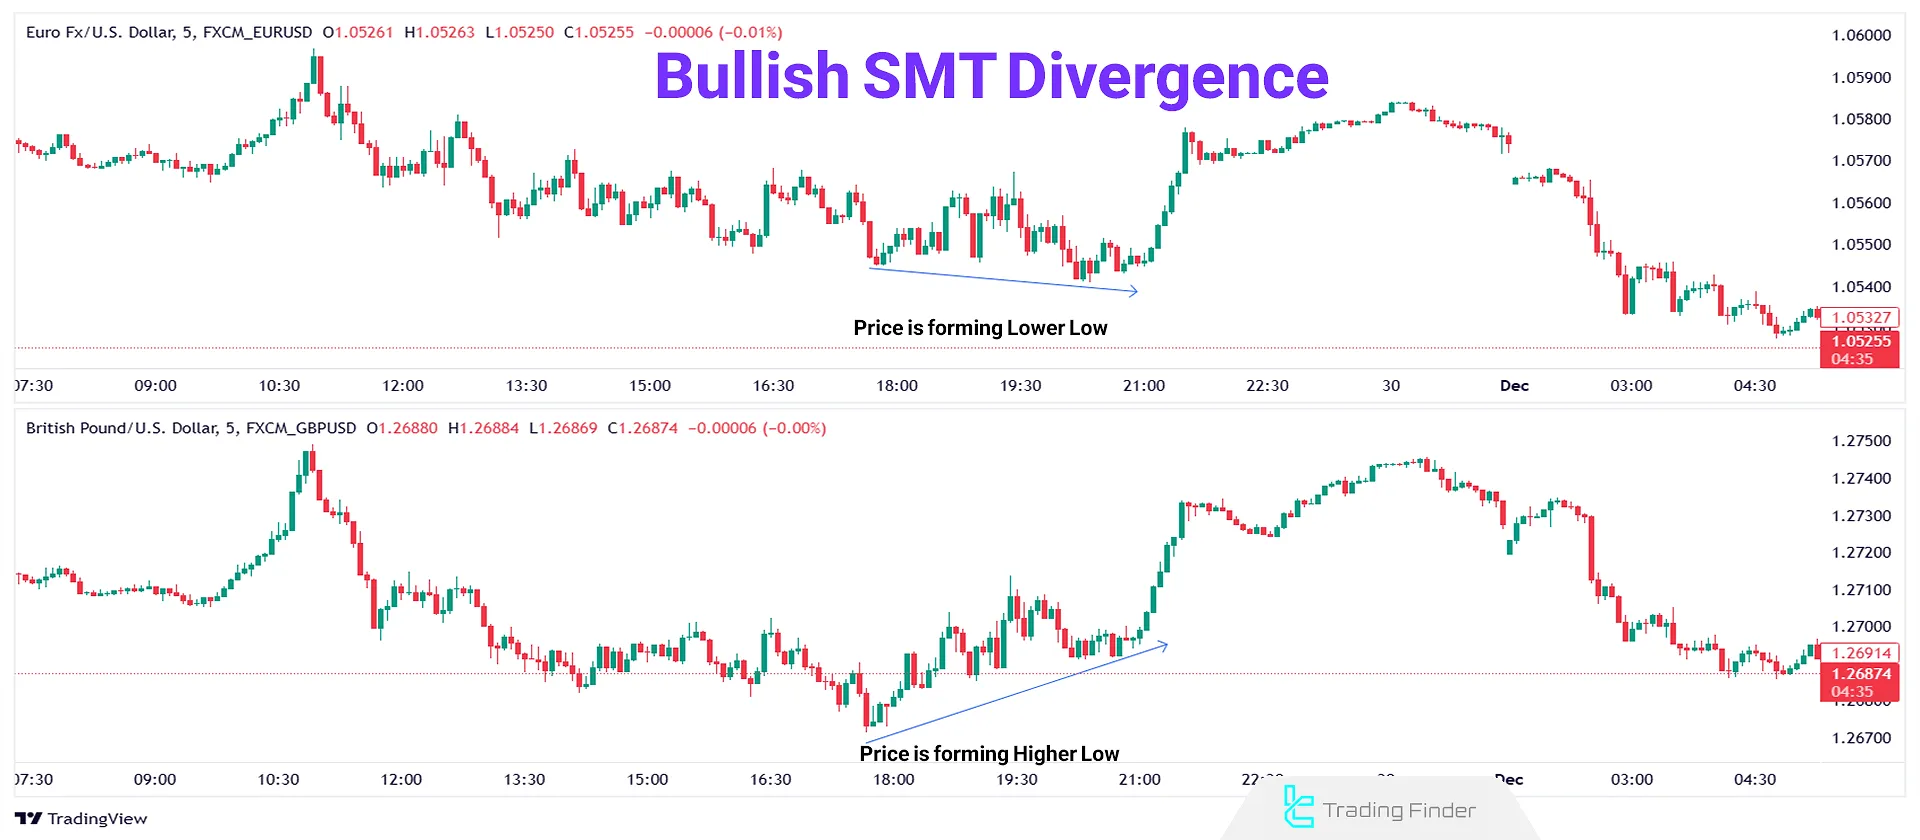
To see these patterns on live charts, the following video provides clear, narrated examples for both indices and forex pairs.
Let's watch some examples from the 'SMT Divergence - ICT Concepts' video by TTrades. This will help you get used to spotting these divergences in real-time.
Watch two clips from the video: Bearish SMT (Indices): From 00:01:36 to 00:02:55. Notice how the S&P 500 makes a higher high, but the NASDAQ does not, preceding a move down. Bullish SMT (Forex): From 00:06:33 to 00:08:00. Observe how EUR/USD makes a lower low while GBP/USD makes a higher low, signaling a reversal.
Test your understanding!
You are watching Gold (XAU/USD) and Silver (XAG/USD), which are positively correlated. Both are in a clear uptrend.
You notice that Gold pushes up and breaks a significant swing high from yesterday. However, at the same time, Silver rallies towards its corresponding swing high but fails to break it and starts to sell off.
- What type of SMT Divergence is this?
- Which asset is showing weakness (is the "smarter" money)?
- What might the move on Gold represent?
Show answer
- This is a Bearish SMT Divergence.
- Silver (XAG/USD) is showing weakness because it failed to make a higher high.
- The higher high on Gold is likely a liquidity grab or stop hunt, designed to trap breakout traders before a potential reversal to the downside.
4. SMT as a Confirmation Tool
As we've discussed, SMT is most powerful when used as a confirmation, not as a standalone entry signal. You should look for it at key areas you've already identified from your higher-timeframe analysis.
High-probability places to look for SMT divergence:
- At a higher-timeframe Order Block or Fair Value Gap (FVG).
- After a Judas Swing has swept the high or low of the Asian session.
- When price is sweeping a significant previous day's high/low.
Imagine you have a bearish daily bias and you've just seen a Judas Swing sweep the Asian high during the London session. If you also spot a Bearish SMT Divergence between ES and NQ at that high, your confidence in a short setup increases dramatically. The SMT confirms the Judas Swing was indeed a manipulation.
A Note on Automation
Your goal includes developing trading bots. A key step in that journey is learning to programmatically identify the concepts you trade manually. SMT is a perfect candidate for this. While we will cover the Python implementation much later in the course, you can begin to see how this logic can be automated.
The TradingView guide below briefly mentions an indicator that automates SMT detection. This is a great example of how a rule-based concept like SMT can be translated into an algorithm.
Smart Money Technique (SMT) Divergences - The Ultimate Guide
This short guide from TradingView, 'Smart Money Technique (SMT) Divergences - The Ultimate Guide', provides a concise summary and points to an interesting tool.
Read the section 'Indicator Used for SMT Divergences'. This is just to show you that the logic we've discussed can be automated, which connects directly to your long-term goal of building trading bots.
Conclusion
You can now recognize one of the most reliable confirmation tools in the ICT arsenal. SMT Divergence provides a quantifiable way to see where smart money is tipping its hand, allowing you to differentiate a genuine trend from a manipulative liquidity grab.
Key Takeaways:
- SMT Divergence occurs when two correlated assets fail to move in sync, with one making a new swing high/low while the other does not.
- A Bearish SMT is a failure to make a higher high, signaling weakness.
- A Bullish SMT is a failure to make a lower low, signaling strength.
- SMT is not an entry signal on its own. It is a powerful confluence to add to your existing analysis, especially at key price levels and after liquidity sweeps like the Judas Swing.
Preview for the Next Lesson:
Now that you can recognize SMT, the next step is to integrate it formally into a trade plan. In our next lesson, we will focus on the learning outcome: Use SMT divergence as a confirmation for taking a position against the apparent trend. We will define precise entry models that combine SMT with market structure shifts and FVGs to execute high-probability reversal trades.