Hello! Welcome back to our final project module.
In the last lesson, we focused on the crucial task of refactoring your thread pool. By applying principles like SRP and OCP and using patterns like Strategy, you've transformed your code into a modular, maintainable, and professional C++ library. This well-structured foundation makes our next step—adding new features—much simpler and cleaner.
Today's lesson is dedicated to implementing a feature that distinguishes a production-ready system from a simple prototype. We will be working on the learning outcome: Add monitoring capabilities to track pool statistics (e.g., active threads, queued tasks).
We'll explore what metrics are valuable to track, how to collect them in a thread-safe and efficient manner, and how to design a clean API for users to access this information. This capability is essential for debugging, performance tuning, and understanding how your thread pool behaves under load.
1. Why Monitor? Visualizing the Goal
Before we dive into implementation, let's establish why monitoring is so important. In any concurrent system, it's difficult to reason about performance just by looking at the code. Are your threads busy or are they idle? Is the task queue growing indefinitely, indicating a bottleneck? Answering these questions requires data.
A good monitoring system can produce visualizations like these:
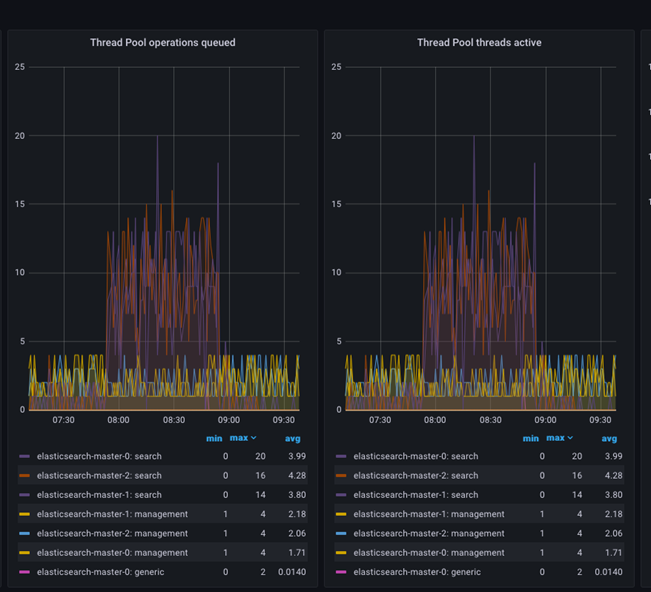

Our goal is to build the backend infrastructure that collects the raw data needed to generate such insights for your thread pool.
2. Defining Key Performance Indicators (KPIs)
What should we measure? A research paper on thread pool design for high-performance databases offers an excellent framework for thinking about this. It suggests separating statistics into logical groups.
Thread Management for High Performance Database Systems
The paper 'Thread Management for High Performance Database...' by Jäschke et al. provides a great overview of designing a monitoring component for a thread pool. It also highlights the important consideration of making monitoring optional to avoid performance overhead when it's not needed.
Please read Section III-A 'Architecture of the Thread Pool' and Section III-F 'Performance monitoring'. Focus on their rationale for making monitoring an optional component and the three categories of statistics they collect: task, thread, and thread pool.
Based on this paper and common practice, here are the core metrics we'll aim to collect for our thread pool:
-
Pool-wide Statistics:
tasks_in_queue: The number of tasks currently waiting to be executed.tasks_submitted: The total number of tasks ever submitted to the pool.tasks_completed: The total number of tasks that have finished execution.active_threads: The number of threads currently executing a task.
-
Per-thread Statistics (More Advanced):
tasks_executed_by_thread: How many tasks each individual worker thread has completed. This helps identify load imbalance.time_spent_busyvs.time_spent_waiting: Helps determine if threads are utilized effectively or if the pool is oversized.
For this lesson, we will focus on implementing the pool-wide statistics, as they provide the most immediate value.
3. Thread-Safe Counting with std::atomic
Our primary challenge is that these statistics will be read and written by multiple threads simultaneously. For example, worker threads will increment tasks_completed, while the main thread might be submitting new tasks and incrementing tasks_submitted.
Using a std::mutex to protect each counter would work, but it's overkill and can become a performance bottleneck. For simple operations like incrementing a counter, C++ provides a much more efficient, lock-free mechanism: std::atomic.
Using std::atomic in modern C++ to update a shared value | Introduction to Concurrency in Cpp
Let's watch a quick introduction to std::atomic from Mike Shah. This video clearly explains how it provides a thread-safe way to perform simple operations without explicit locks.
Watch from the beginning until 03:11. Pay attention to how std::atomic<int> replaces a regular int and a mutex, and how simple operators like ++ and += are overloaded to be atomic.
An atomic operation is indivisible—it cannot be interrupted by another thread partway through. On most modern processors, incrementing an atomic integer compiles down to a single hardware instruction (like lock xadd on x86), which is significantly faster than acquiring and releasing a mutex, which involves system calls in the contended case.
So, to implement our monitoring, we can create a statistics structure like this:
#include <atomic>
#include <cstddef> // For size_t

struct ThreadPoolStats {
    std::atomic<size_t> submitted_tasks{0};
    std::atomic<size_t> completed_tasks{0};
    std::atomic<size_t> active_threads{0};
};
You would then instrument your ThreadPool code:
- In
submit(), you'd callstats.submitted_tasks++. - In the worker loop, you'd increment
stats.active_threadsbefore running a task and decrement it after. - Also in the worker loop, you'd increment
stats.completed_tasksafter a task is finished.
Test your understanding!
In the ThreadPool's worker loop, a task is fetched from the queue, executed, and then the loop repeats. What is the potential issue with the following sequence of operations?
stats.active_threads++;task();stats.completed_tasks++;stats.active_threads--;
What happens if the task throws an exception? How would you fix this using the RAII idiom we learned about previously?
Show answer
If task() throws an exception, the stats.active_threads-- line will be skipped. The active_threads count will be permanently inflated, leading to incorrect metrics.
A robust solution uses RAII. You can create a simple helper class that increments the counter on construction and decrements it on destruction. This guarantees the counter is decremented when the scope is exited, whether normally or via an exception.
class ActiveThreadTracker {
public:
    ActiveThreadTracker(std::atomic<size_t>& counter) : counter_(counter) {
        counter_++;
    }
    ~ActiveThreadTracker() {
        counter_--;
    }
private:
    std::atomic<size_t>& counter_;
};

// In the worker loop:
{
    ActiveThreadTracker tracker(stats.active_threads);
    task();
} // tracker is destroyed here, counter is decremented
stats.completed_tasks++;
4. The Hidden Cost of Atomics: Contention and Memory Ordering
While std::atomic is much better than a mutex, it's not free. When multiple threads frequently update the same atomic variable, you can still have a performance problem called high contention. This leads to "cache line bouncing," where the cache line holding the atomic variable is constantly being invalidated and shuttled between different CPU cores. This is what the "Concurrency Cost Hierarchy" refers to as "Level 2: True Sharing."
For a deeper understanding of concurrency costs and how to mitigate them, the following article is an invaluable resource. It's advanced, but your background in systems makes you perfectly suited to appreciate its insights.
The article 'A Concurrency Cost Hierarchy' by Travis Downs categorizes concurrent operations by performance cost. It provides a mental model for identifying and optimizing performance bottlenecks in multithreaded code.
This is a dense but highly rewarding read. Spend about 15-20 minutes on it, focusing on these key ideas: Skim the main table in 'The Table' section to understand the different cost levels. Read 'Level 2: True Sharing' to understand the problem with our simple atomic counter design. Read 'Level 0: Vanilla' to see the ideal solution: using thread_local storage to give each thread its own private counter, eliminating contention entirely. Note the trade-off: read() becomes more complex.
The key takeaway is that for a counter like completed_tasks, which is updated by every worker thread, a single shared std::atomic can become a bottleneck. A more scalable design is to use thread_local counters. Each worker thread updates its own private counter (a "Level 0" operation, extremely fast). The public get_statistics() function would then have the slightly more complex job of summing up all the thread_local counters to get a global total.
This is a classic performance trade-off: you make the write path (incrementing) faster at the cost of making the read path (getting the total) slower. For monitoring, where writes are frequent and reads are less frequent, this is often a very good trade.
A Note on Memory Ordering
When you use atomics, you can specify a memory order. This tells the compiler and CPU how to order memory operations around the atomic access. For simple counters where you don't need to synchronize other data, you can often get a performance boost by using the most lenient ordering.
Arvid Norberg: The C++ memory model: an intuition
To understand memory ordering, let's watch this excerpt from Arvid Norberg's talk. It provides a great intuition for the different memory orders.
Please watch from 14:56 to 18:13 to learn about memory_order_relaxed, and then from 12:35 to 14:40 to understand the default, memory_order_seq_cst. The key idea is that relaxed is fastest but provides no ordering guarantees, making it suitable only for things like simple counters.
For our counters, using std::memory_order_relaxed is appropriate and can improve performance:stats.completed_tasks.fetch_add(1, std::memory_order_relaxed);
5. Designing the Monitoring API
Finally, we need to expose these statistics to the user of your library. A good approach is to provide a method that returns a snapshot of the current stats in a simple, non-atomic struct.
// A simple struct to hold a snapshot of the stats.
// The user doesn't need to know about atomics.
struct ThreadPoolMetrics {
    size_t submitted_tasks;
    size_t completed_tasks;
    size_t queued_tasks;
    size_t active_threads;
};

class ThreadPool {
public:
    // ... other methods ...

    // Returns a snapshot of the current pool metrics.
    // This is a const method as it doesn't change the pool's state.
    ThreadPoolMetrics get_metrics() const {
        ThreadPoolMetrics metrics;
        metrics.submitted_tasks = stats_.submitted_tasks.load(std::memory_order_relaxed);
        metrics.completed_tasks = stats_.completed_tasks.load(std::memory_order_relaxed);
        // The number of queued tasks can often be read directly from your queue's size() method.
        // This might require a lock, but it's only taken when metrics are requested.
        metrics.queued_tasks = task_queue_.size();
        metrics.active_threads = stats_.active_threads.load(std::memory_order_relaxed);
        return metrics;
    }

private:
    ThreadPoolStats stats_;
    // ... other members ...
};
This design provides a clean separation. The internal implementation uses efficient atomics, but the public API is simple and safe.
Conclusion
You now have a solid plan for adding a professional monitoring feature to your thread pool. This not only makes your library more useful but also demonstrates your understanding of critical advanced C++ and systems concepts.
Key Takeaways:
- Monitoring is Essential: It provides the data needed to understand and tune the performance of a concurrent system.
- Use
std::atomicfor Counters: It's the right tool for thread-safe, high-performance counting, avoiding the overhead of mutexes. - Beware of Contention: Even atomics can become a bottleneck under high contention ("True Sharing"). For frequently updated, shared data, consider patterns like thread-local storage to move towards contention-free ("Vanilla") operations.
- Leverage Memory Ordering: Using
std::memory_order_relaxedfor simple counters can provide a performance benefit by reducing synchronization overhead. - Design a Clean API: Hide implementation details like atomics from the user by providing a snapshot method that returns a simple data structure.
Next Lesson Preview:
In our final lesson, you will prepare a presentation explaining the project's architecture, design patterns used, and technical challenges overcome. The work you've done on performance analysis, refactoring, and now monitoring, will be fantastic material. Being able to discuss the trade-offs between a simple atomic counter and a thread-local design will strongly signal your depth of knowledge to a potential employer.