Hello! Welcome back.
In our last lesson, we dissected the data structures at the heart of C++ polymorphism: the per-object vptr and the per-class vtable. We saw how a derived class's vtable is constructed and what hidden information it contains.
Today, we'll put that knowledge into motion. Our goal is to trace a virtual function call through the vtable lookup process at runtime and compare its overhead to a non-virtual call. We will follow the chain of pointers from the object to the final function code, examine the assembly instructions involved, and analyze why this mechanism, while powerful, is not "free."
1. The Anatomy of a Virtual Function Call
Let's start with a classic polymorphic scenario:
// Base class with virtual functions
struct Animal {
    virtual void speak() { /* ... */ }
};

// Derived class overriding the virtual function
struct Dog : public Animal {
    void speak() override { /* ... */ }
};

int main() {
    Animal* p_animal = new Dog(); // Base pointer, Derived object
    p_animal->speak();            // Which speak() gets called?
    delete p_animal;
}
The call p_animal->speak() is where dynamic dispatch happens. At compile time, the compiler only knows that p_animal is an Animal*. It cannot hardcode a jump to Animal::speak or Dog::speak. Instead, it generates code to perform a lookup at runtime.
This lookup follows a precise sequence of steps:
- Get the object address: The process starts with the address stored in
p_animal. - Find the
vptr: The code dereferencesp_animalto access theDogobject's memory. It reads the first 8 bytes (on a 64-bit system), which is the hiddenvptr. - Find the
vtable: Thevptr's value is the memory address of theDogclass'svtable. The code follows this pointer to thevtable, which is located in a read-only segment of the program. - Find the function address: The compiler knows that
speak()is the first virtual function in theAnimalclass, so its entry is at index 0 of thevtable. The code reads the function pointer from this slot. In this case, because the object is aDog, it gets the address ofDog::speak. - Call the function: The CPU executes a call instruction using the address retrieved in the previous step.
To see this process visualized clearly, watch the following short segment.
C++ Inheritance Explained: V-Tables, Virtual Destructors & Edge Cases
The video 'C++ Inheritance Explained' from the DeepDiveDev channel provides a concise, step-by-step animation of the virtual call mechanism.
Watch from 06:26 to 07:02. This segment perfectly illustrates the three steps: get the vptr, follow it to the vtable, and look up the function pointer at the correct index.
The diagram below, based on the article we'll review next, shows this entire chain from the object on the stack to the function code in the text section.
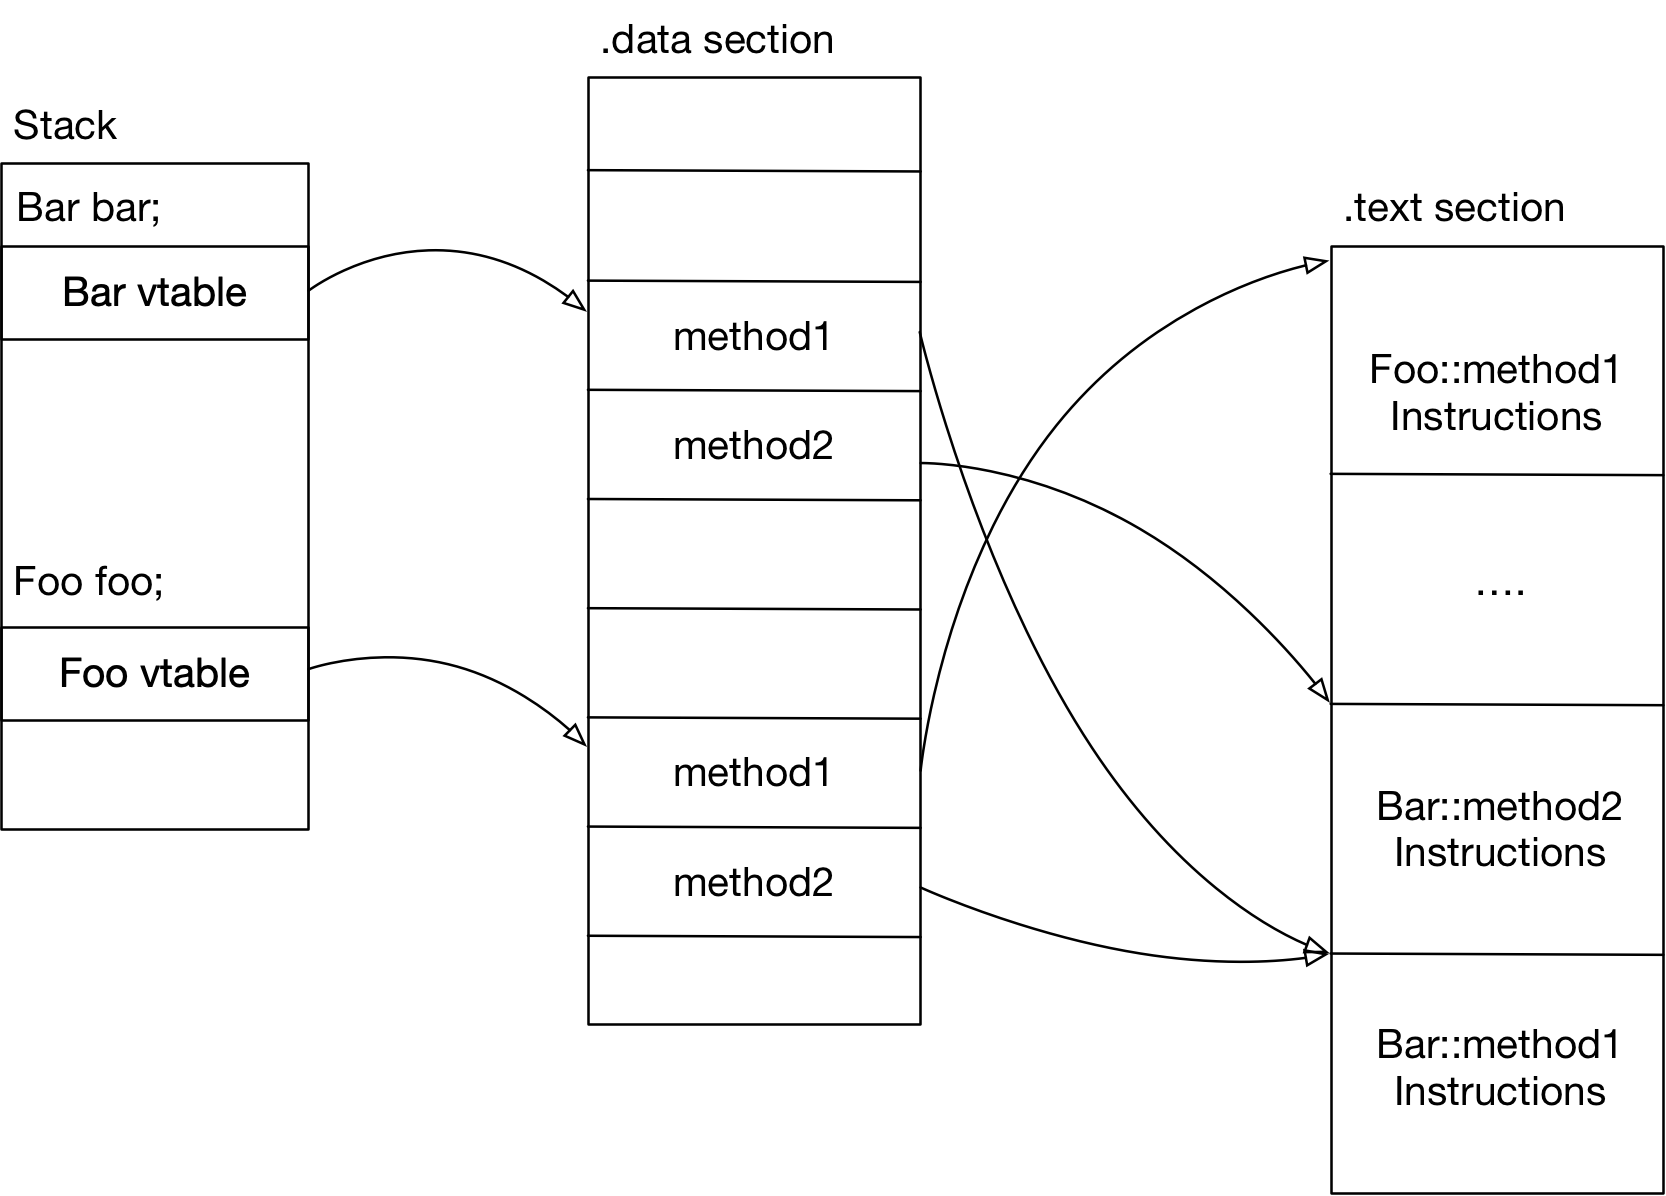
2. From C++ to Assembly: The Ground Truth
Your desire to understand things from first principles is best satisfied by looking at the assembly code the compiler generates. This is as close as we can get to what the CPU actually executes. Given your background in C, you'll recognize that the "magic" of a virtual call is just a series of pointer dereferences.
The following article demonstrates this by examining the assembly for a virtual call inside a loop.
Understand C++ vtable from assembly code (part 1)
The article 'Understand C++ vtable from assembly code (part 1)' by Guihao Liang does an excellent job of breaking down the generated assembly.
Please read the section titled 'Assembly code for vtable implementation'. Focus on the commented assembly block that traces the call to ptr->method1() and ptr->method2(). Pay attention to how it loads the object pointer, dereferences it twice to get the function address, and then uses call.
Let's dissect the core instructions for ptr->method1() from that article:
// Let's assume the current object pointer `ptr` is in register `r10` for clarity.

// 1. Get the vptr from the object.
//    Load the value at the address in r10 into r11. This is the vptr.
mov r11, QWORD PTR [r10]

// 2. Get the function address from the vtable.
//    Load the value at the address in r11 (the vtable's start) into r12.
//    This is the address of the first virtual function (method1).
mov r12, QWORD PTR [r11]

// 3. Call the function.
//    Pass the 'this' pointer (the object's address) in the first argument register (rdi on Linux).
mov rdi, r10
//    Execute an indirect call to the address held in r12.
call r12
Compare this to a non-virtual call (call MyClass::my_function), which is a single instruction that jumps to a hardcoded address known at compile time. The virtual call involves extra memory reads and an indirect jump, which brings us to the question of performance.
3. The Performance Cost of Dynamic Dispatch
A virtual function call has overhead from three primary sources.
A. Direct Cost: Indirection and Cache Misses
The most obvious cost is the pointer chasing we just saw: Object -> vptr -> vtable -> Function. Each of these arrows represents a memory access. In a worst-case scenario where the object, the vtable, and the function code are not in the CPU cache, each step could trigger a slow trip to main memory.
However, as the following video explains, this direct cost is often small for well-behaved programs where the data is hot in the cache.
The Hidden Performance Price of C++ Virtual Functions - Ivica Bogosavljevic - CppCon 2022
The CppCon 2022 talk 'The Hidden Performance Price of C++ Virtual Functions' provides excellent quantitative analysis of this overhead.
Watch the segment from 06:10 to 08:46. It presents an experiment comparing short and long virtual vs. non-virtual calls, showing that the direct overhead is measurable but often negligible for functions that do significant work.
B. Indirect Cost: The Inlining Barrier
The most significant performance penalty of virtual calls is often indirect: they prevent compiler optimizations, most notably inlining.
- Inlining is when the compiler replaces a function call with the body of the function itself, eliminating the overhead of setting up a stack frame and jumping. More importantly, it exposes the function's code to the surrounding context, enabling a cascade of further optimizations (like vectorization or removing redundant checks).
- With a virtual call, the compiler doesn't know the destination at compile time, so it cannot inline the function. It must generate a full, heavyweight function call.
This video segment explains this crucial concept beautifully.
C++ Inheritance Explained: V-Tables, Virtual Destructors & Edge Cases
Let's return to the 'C++ Inheritance Explained' video for a clear demonstration of why the loss of inlining is so impactful.
Watch from 12:44 to 14:31. The video contrasts a simple, inlinable math function with a virtual one inside a tight loop to show how the inability to inline can lead to orders-of-magnitude performance differences.
C. CPU Cost: Branch Misprediction
Modern CPUs use speculative execution to improve performance. For an indirect jump like a virtual call, the CPU's branch predictor tries to guess the destination address.
- If you are looping through a collection of objects that are all of the same type (e.g., a
std::vectorofDogobjects), the branch predictor will quickly learn the destination and the overhead becomes minimal. - If the types are random, the predictor will constantly guess wrong. A misprediction is expensive, as the CPU must discard the speculatively executed work and restart the pipeline from the correct location.
This CppCon talk provides a powerful experiment demonstrating this effect.
The Hidden Performance Price of C++ Virtual Functions - Ivica Bogosavljevic - CppCon 2022
This segment from the CppCon talk shows how CPU architecture interacts with virtual calls.
Watch from 25:46 to 29:24. The experiment compares call times on sorted vs. random object types, clearly showing the performance penalty of branch misprediction when the call pattern is unpredictable.
4. Compiler Magic: Devirtualization
Given these costs, you might think virtual functions are a performance landmine. However, modern compilers are incredibly smart and can often eliminate the overhead through an optimization called devirtualization. The compiler tries to prove the concrete type of an object at a call site. If it succeeds, it can replace the virtual call with a direct, inlinable call.
Optimizations in C++ Compilers
The article 'Optimizations in C++ Compilers' from ACM Queue details how compilers can sometimes inline virtual calls.
Read the section 'Devirtualization'. It shows assembly where GCC performs speculative devirtualization: it bets on the object's type, inserts a quick check, and then executes the inlined code. It also mentions how the final keyword helps the compiler perform this optimization.
Test your understanding!
Consider a non-virtual call obj.non_virtual_func() versus a virtual call ptr->virtual_func().
Using a tool like Godbolt Compiler Explorer, compile a small example for both cases. What is the key difference in the final call instruction you observe in the generated x86-64 assembly?
Show answer
For the non-virtual call, you will typically see a direct call to a label:call MyClass::non_virtual_func()
This jumps to a fixed address that is resolved by the linker.
For the virtual call, you will see an indirect call via a register:call rax (or another register)
This jumps to the address that was dynamically loaded into the rax register from the vtable just before the call. This is the "indirect" part of the indirect function call.
Conclusion
Today, we traced the entire lifecycle of a virtual function call, from high-level C++ down to the assembly instructions. We've seen that it's a deterministic, mechanical process, not magic.
Key Takeaways:
- A virtual call is resolved at runtime through a two-step pointer lookup:
object -> vptr -> vtable -> function_address. - The primary performance cost of virtual functions is not the direct lookup overhead, but the indirect cost of blocking compiler optimizations, especially inlining.
- CPU-level features like branch prediction significantly affect performance; predictable call patterns are fast, while random patterns are slow due to mispredictions.
- Modern compilers are highly adept at devirtualization, often succeeding in converting virtual calls back into faster, direct calls when the object's type can be determined.
In our next lesson, we will address a critical and common bug in polymorphic code: resource leaks. We will learn why you must implement and explain the necessity of virtual destructors for preventing resource leaks in polymorphic deletion. This is a direct application of the virtual mechanism we've just studied to ensure program correctness.