Hello! In our last session, we explored how to use learning curves to diagnose whether a model suffers from high bias or high variance by plotting its "error" against the training set size. However, we left a crucial question unanswered: what exactly is this "error," and how do we measure it?
Today, we will address that question directly. This lesson focuses on quantifying the performance of regression models—models that predict continuous numerical values. You will learn to select and compute the three most fundamental evaluation metrics for regression: Mean Squared Error (MSE), Mean Absolute Error (MAE), and the Coefficient of Determination (R²). Understanding these metrics is not just about calculating a score; it's about choosing the right tool to measure what you truly care about in your model's predictions. This is a vital step toward building a rigorous and practical understanding of machine learning.
The Foundation: Residuals
Before we can aggregate errors into a single metric, we must first define the error for a single prediction. In regression, this is called the residual.
For a given data point , with an actual value and a model prediction , the residual is simply their difference:
A positive residual means the model under-predicted, while a negative residual means it over-predicted. Every metric we discuss today is simply a different method of averaging these individual residuals across an entire dataset to produce a single, representative score.
The NVIDIA technical blog provides a clear definition of residuals.
A Comprehensive Overview of Regression Evaluation ...
This article starts by defining the core concept of residuals, which is foundational to everything that follows.
Please read the short section A quick primer on residuals. The accompanying figure provides a helpful visual of what residuals look like in the context of a linear model's fit.
Now that we have our building block, let's explore the two primary ways we aggregate these residuals into an overall error metric.
Error Metrics in the Target's Units: MAE and MSE
The most straightforward way to measure total error is to average the residuals. However, since residuals can be positive or negative, they would cancel each other out. To solve this, we use either the absolute value or the square of the residuals. This gives rise to MAE and MSE.
Mean Absolute Error (MAE)
The Mean Absolute Error is the average of the absolute values of the residuals.
Interpretation: MAE tells you, on average, how far your predictions are from the actual values, measured in the original units of your target variable (e.g., dollars, degrees Celsius). If the MAE of a house price model is 25,000, it means your predictions are, on average, off by $25,000. This makes it highly interpretable, especially for non-technical stakeholders.
Mean Squared Error (MSE) and Root Mean Squared Error (RMSE)
The Mean Squared Error is the average of the squared residuals.
Interpretation: By squaring the errors, MSE penalizes larger mistakes much more heavily than smaller ones. An error of 10 contributes 100 to the sum, while an error of 2 contributes only 4. This is a desirable property if large errors are particularly costly or dangerous in your application.
However, the units of MSE are the square of the target's units (e.g., dollars squared), which is not intuitive. To fix this, we often take the square root of the MSE to get the Root Mean Squared Error (RMSE).
RMSE is also in the same units as the target variable, making it more interpretable than MSE. Because of its relationship with MSE, it also heavily penalizes large errors.
For the formal mathematical definitions of these metrics, you can refer to the following paper.
The coefficient of determination R-squared is more ...
This paper provides the formal mathematical formulas for several key regression metrics.
In the "Mathematical background" subsection, review the formulas and brief descriptions for Mean square error (MSE), Root mean square error (RMSE), and Mean absolute error (MAE).
The Key Difference: Sensitivity to Outliers
The choice between MAE and MSE/RMSE is a critical one and hinges on how you want to treat outliers.
- MAE is robust to outliers. It gives a proportional penalty to all errors, so a large outlier will contribute to the overall error linearly.
- MSE/RMSE are sensitive to outliers. The squaring term means that a single prediction with a very large error can dominate the entire metric.
The image below provides an excellent visual summary of this core difference.

Another important distinction, which speaks to your goal of understanding the underlying mechanics, is their mathematical properties. MSE is a smooth, differentiable function everywhere, which makes it convenient for optimization algorithms like gradient descent that rely on derivatives. MAE, on the other hand, is not differentiable at zero, which can complicate optimization. This is a primary reason why MSE is so frequently used as a loss function during model training.
The following video provides a clear walkthrough of these metrics, their interpretation, and when you might prefer one over the other.
Evaluation Metrics For Regression - When & Why To Use What
This video by NeuralNine offers a practical comparison of the most common regression metrics.
Please watch the segments covering MSE and RMSE and Mean Absolute Error (MAE). Pay close attention to the discussion of their interpretability, units, and sensitivity to large errors.
Relative Performance: Coefficient of Determination (R²)
MAE and RMSE give us a sense of the absolute error in the native units of our target. But an RMSE of $10,000 might be excellent for a model predicting mansion prices and terrible for a model predicting bicycle prices. We need a scale-free, relative metric. This is where R-squared (R²) comes in.
R² answers the question: "How much better is our model than a naive baseline model that just predicts the average of the target variable for every data point?"
It is defined as the proportion of the total variance in the target variable that is explained by your model.
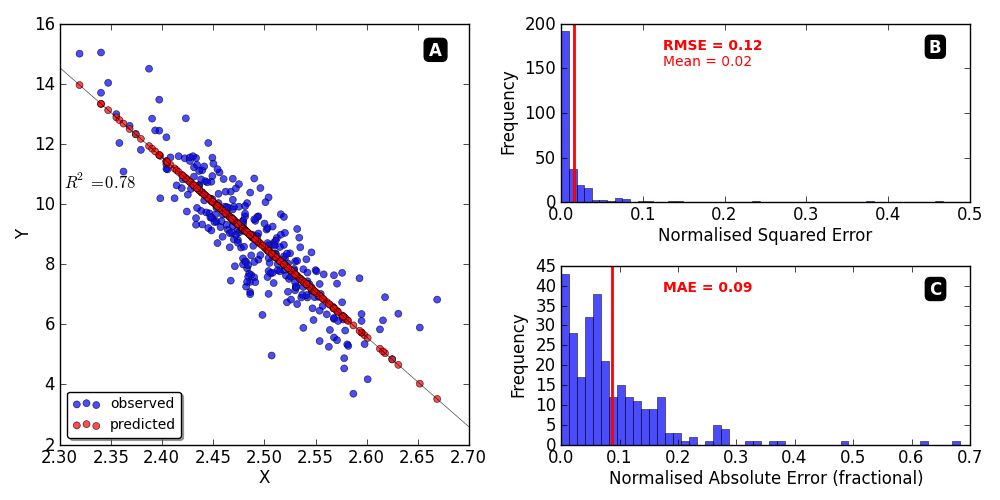
The StatQuest video below gives the best intuitive explanation of R² available. It builds the concept from the ground up and is essential viewing.
R-squared, Clearly Explained!!!
This video by Josh Starmer is a classic for a reason. It masterfully explains the intuition behind R-squared as the "percentage of variation explained".
Please watch this video from the beginning up to the first full example. This will walk you through the entire calculation and conceptual basis. Then, watch the summary segment on the two main ideas of R².
As explained in the video, the formula for R² is:
Where is the mean of the actual values.
Interpretation of R²:
- R² = 1.0: The model explains 100% of the variance in the data. The predictions perfectly match the actual values.
- R² = 0.0: The model explains none of the variance. It performs no better than simply predicting the mean every time.
- R² < 0.0: The model is actively worse than the simple mean-based model. This can happen with poorly performing models, especially non-linear ones, on unseen test data.
The NVIDIA blog has a great section that formally defines R² and discusses some of its important nuances.
A Comprehensive Overview of Regression Evaluation ...
This section provides the formal definition of R-squared and discusses important considerations, like the possibility of it being negative.
Read the section on R-squared. The diagram here is useful for visualizing the comparison between your model's fit (the red line) and the mean benchmark (the green line).
Selecting the Right Metric
So, which metric should you use? The answer, as is common in machine learning, is: "it depends." The choice is a crucial part of framing your problem correctly.
-
Choose MAE when you want a metric that is easily interpretable by business stakeholders ("we are off by X dollars on average") and when you don't want large errors or outliers to have an outsized influence on the metric.
-
Choose RMSE when large errors are especially undesirable and you want to penalize your model for making them. It is very common in academic settings and as an optimization objective for its mathematical properties.
-
Choose R² when you need a scale-free metric to communicate the "goodness of fit." It is excellent for comparing model performance across different datasets where the target variables (and thus the absolute errors) are on different scales.
The paper we looked at earlier makes a strong argument that bounded, relative metrics like R² are often more informative than unbounded metrics like MAE or MSE, whose values are difficult to interpret in isolation.
The coefficient of determination R-squared is more ...
This paper argues for the superiority of R² by highlighting the interpretation challenges of other metrics and providing use cases where they can be misleading.
First, read the subsection on Informativeness to understand why a metric with a fixed range like R² can be more useful than one with an unbounded range like MSE. Then, skim the Use cases section. You don't need to digest all the math, but notice how in several examples (like UC2 and UC4), metrics like SMAPE (a relative of MAPE) can give a misleadingly positive score while R² correctly identifies a poor model. This highlights the importance of choosing your metric wisely.
Conclusion
In this lesson, we have armed ourselves with a toolkit for measuring the performance of regression models. You now have the ability not just to compute error, but to select the metric that best reflects the goals of your specific problem.
Key Takeaways:
- Mean Absolute Error (MAE) measures the average absolute difference between predictions and actuals. It is robust to outliers and easily interpretable.
- Mean Squared Error (MSE) and Root Mean Squared Error (RMSE) measure the average squared difference. They heavily penalize large errors and are mathematically convenient for optimization.
- R-squared (R²) measures the proportion of variance in the target variable that is explained by the model. It provides a scale-free measure of relative performance against a simple baseline.
- The choice of metric is a critical decision that depends on your sensitivity to outliers and your need for interpretability versus a measure of relative fit.
So far in this module, we've formalized supervised learning, analyzed the bias-variance tradeoff, diagnosed it with learning curves, and now quantified regression error. In our next lesson, we will pivot from regression to classification tasks. You will learn about a new set of evaluation tools, starting with the confusion matrix and the metrics derived from it: accuracy, precision, recall, and F1-score.