In our previous lesson, we established the cardinal rule of model validation: split your data into training and testing sets before any other preprocessing. This step is your primary defense against data leakage and is fundamental to building models whose performance you can trust.
Today, we will take the next logical step in our preprocessing pipeline: feature scaling. Many machine learning algorithms perform better or converge faster when features are on a relatively similar scale. This lesson will teach you the two most common scaling techniques, normalization and standardization. You will learn not only how to apply them using scikit-learn but, more importantly, develop the intuition to decide which one is appropriate for a given situation and algorithm.
Why Is Feature Scaling Necessary?
Machine learning algorithms are fundamentally mathematical. They don't understand the "meaning" or units of your features (e.g., age in years, salary in dollars); they only see the numbers. If one feature has a range of 0-100 and another has a range of 0-1,000,000, the algorithm might incorrectly assume that the second feature is thousands of times more important, simply because its magnitude is larger. This can cause significant problems for two main classes of algorithms.
- Algorithms using Gradient Descent: Models like linear regression, logistic regression, and neural networks find the optimal parameters by iteratively minimizing a cost function using gradient descent. If features are on vastly different scales, the cost function's surface becomes elongated and elliptical. The optimization algorithm will then tend to oscillate back and forth on the steep axes and converge very slowly on the shallow ones. Scaling the features creates a more spherical, well-behaved cost surface, allowing the optimizer to find the minimum much more directly and efficiently.
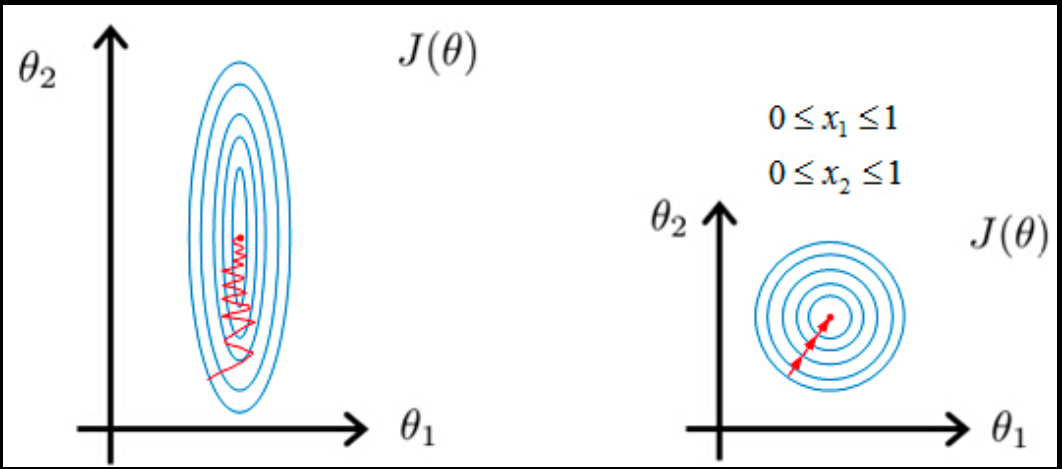
- Algorithms using Distance Calculations: Models such as K-Nearest Neighbors (KNN), Support Vector Machines (SVM), and K-Means Clustering rely on calculating the distance between data points (e.g., Euclidean distance). If features are not scaled, the feature with the largest range will completely dominate the distance calculation, drowning out the contribution of other features.
The following video provides an excellent visual intuition for these two points.
Standardization vs Normalization Clearly Explained!
This video from the channel Normalized Nerd clearly illustrates why feature scaling is critical for both gradient descent and distance-based algorithms.
Watch these two key segments: Faster Convergence: This part visually explains how different feature scales can cause oscillations during gradient descent. Computing Distances: This segment shows how an unscaled feature can dominate distance calculations.
Not all algorithms are sensitive to feature scale. Tree-based models like Decision Trees, Random Forests, and Gradient Boosting models (XGBoost, etc.) are scale-invariant. They work by splitting features based on thresholds (e.g., age > 30), and the quality of a split depends only on the order of the values, not their magnitude.
Now, let's dive into the two primary methods for scaling your data.
Normalization (Min-Max Scaling)
Normalization, often called Min-Max Scaling, rescales each feature to a fixed range, typically [0, 1]. The transformation is performed using the following formula:
Here, and are the minimum and maximum values of the feature in the training data, respectively. This transformation linearly shifts and scales the data so that the minimum value becomes 0 and the maximum value becomes 1.
Key Characteristics:
- Bounded Output: Guarantees that all scaled values will be within a specific range (e.g., [0, 1]). This can be beneficial for algorithms that expect inputs within a certain range, such as neural networks with sigmoid activation functions.
- Preserves Distribution Shape: Normalization does not change the shape of the original feature's distribution.
- High Sensitivity to Outliers: Since the scaling is based on the absolute minimum and maximum values, a single extreme outlier can drastically shrink the range of the "normal" data points, squashing them into a very small interval. This can reduce the feature's usefulness.
In scikit-learn, this is implemented using the MinMaxScaler.
Standardization (Z-Score Scaling)
Standardization, or Z-score Scaling, transforms the data to have a mean of 0 and a standard deviation of 1. It does not bound the values to a specific range. The formula for standardization is:
Here, is the mean and is the standard deviation of the feature in the training data. The resulting value, or z-score, represents the number of standard deviations a data point is from the mean.
Key Characteristics:
- Unbounded Output: The transformed values are not constrained to a particular range.
- Robustness to Outliers: Because standardization uses the mean and standard deviation, it is less affected by extreme outliers compared to min-max scaling. While outliers will still influence the mean and standard deviation, their impact is generally less dramatic.
- Centers Data at Zero: This is often beneficial for algorithms that assume features are centered around zero, like PCA and many linear models.
In scikit-learn, this is implemented using the StandardScaler.
The image below provides a simple visual comparison of what happens to a scatter plot of data after applying normalization versus standardization.
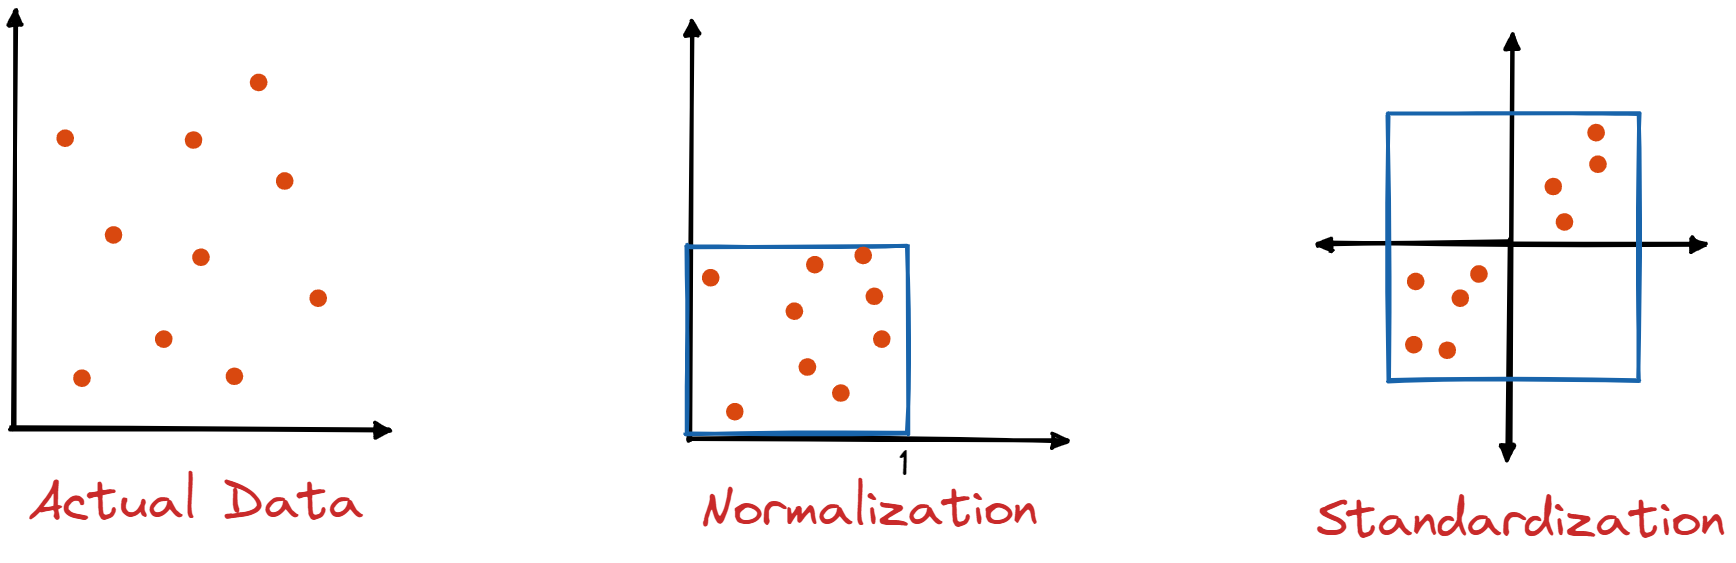
The following guide gives a more detailed breakdown of these two techniques.
Standardization vs Normalization: A Practical Guide to Feature Scaling
This article from letsdatascience.com provides a fantastic overview of both scaling methods, including their formulas, plain-English explanations, and when to use them.
Please read the following two sections: "Normalization with min-max scaling": Focus on the formula, the explanation, and the section on when to choose it. "Standardization with z-score scaling": Again, focus on the formula, the z-score interpretation, and the section on when to use it.
The Correct Workflow: Avoiding Data Leakage
As we established in the previous lesson, you must split your data first. This rule is paramount when scaling. The scaling parameters (min/max for normalization, mean/std for standardization) must be learned only from the training data. These learned parameters are then used to transform both the training and test sets.
The correct workflow is:
- Split your data into
X_train,X_test,y_train,y_test. - Create an instance of your scaler (e.g.,
StandardScaler). - Fit the scaler to the training data and transform it:
scaler.fit_transform(X_train). Thefitstep learns the and (or min/max), and thetransformstep applies the scaling. - Transform the test data using the same fitted scaler:
scaler.transform(X_test). Notice we only calltransform, notfit_transform. We do not want to learn new parameters from the test set; that would be data leakage.
This ensures that no information about the test set's distribution "leaks" into the training process. It also means that some values in the scaled test set might fall outside the [0, 1] range (for MinMaxScaler) or be more than 3-4 standard deviations from the mean (for StandardScaler). This is expected and correct behavior.
Normalization Vs. Standardization (Feature Scaling in Machine Learning)
This video by Prof. Ryan Ahmed provides a full, practical walkthrough of applying both scalers in Python, reinforcing the concepts with code.
Watch the entire video. The host walks through loading data with pandas, visualizing the different scales, and then applies both MinMaxScaler and StandardScaler step-by-step in a Jupyter notebook. Pay close attention to the code structure and the "before and after" statistical summaries. The video can be watched from start to finish.
Choosing the Right Scaler: A Practical Guide
With several options available, how do you choose? Here's a decision framework and summary.
- Do you have significant outliers? If your data has extreme outliers that you can't or shouldn't remove,
RobustScaler(which uses the median and interquartile range) is often the best choice. While we focus onStandardScalerandMinMaxScalerin this lesson, it's a valuable tool to be aware of. If outliers are not a major issue, proceed. - Does your algorithm require bounded input? If yes (e.g., some neural network architectures, image processing), use
MinMaxScaler. - In most other cases, default to
StandardScaler. It is the safest and most common general-purpose scaler. It works well for PCA, linear models, SVMs, and other algorithms that are sensitive to scale.
The following resource provides a superb summary table and a list of algorithms that require scaling.
Standardization vs Normalization: A Practical Guide to Feature Scaling
This guide provides an excellent summary table and a flowchart to help you choose the right scaler for your specific use case.
Please read these two sections: "Which algorithms need scaling": Review the summary table to understand which models are affected by feature scale. "Choosing the right scaler": Read this section and study the decision framework and summary table. This directly addresses the core question of when to use each technique.
Conclusion
In this lesson, we explored the critical preprocessing step of feature scaling. We've learned not just how to scale our data, but why it's necessary for many popular machine learning algorithms.
Key Takeaways:
- Why Scale? To ensure features with large magnitudes don't dominate algorithms that rely on gradient descent or distance calculations.
- Normalization (
MinMaxScaler) scales data to a fixed range, usually [0, 1]. It's useful for algorithms that require bounded inputs but is sensitive to outliers. - Standardization (
StandardScaler) scales data to a mean of 0 and a standard deviation of 1. It's a robust, general-purpose choice and is often the default scaler. - Correct Workflow: Always split your data first. Fit the scaler on the training data only, then use it to transform both the training and test sets to prevent data leakage.
- Tree-based models (like Random Forest) are scale-invariant and do not require feature scaling.
Having now learned how to split our data and scale our numerical features, we are ready to tackle another common data type: categorical variables. In the next lesson, we will learn how to convert text-based categories into a numerical format that machine learning models can understand using techniques like one-hot and label encoding.