Following our work on handling missing data, we now turn our attention to another critical aspect of data cleaning: outliers. These are data points that deviate significantly from the rest of the observations and can have a disproportionate impact on statistical analyses and machine learning models. Your background in probability and statistics will be particularly useful here, as the methods for detecting outliers are grounded in statistical principles.
This lesson will focus on two of the most fundamental and widely used statistical methods for outlier detection. By the end of our session, you will be able to:
- Detect outliers using the Z-score method, which is based on the properties of the normal distribution.
- Detect outliers using the Interquartile Range (IQR) method, a robust technique based on data quartiles.
We will explore the intuition behind each method, their respective strengths and weaknesses, and how to implement them in Python.
What are Outliers and Why Do They Matter?
Before we dive into detection methods, it's important to understand what an outlier is and the problems it can cause. An outlier is an observation that lies an abnormal distance from other values in a random sample from a population.
How to Detect Outliers in Python: A Comprehensive Guide
This article from the TrainInDATA blog provides an excellent introduction to outliers and their impact.
Read the introductory sections, starting from "What Are Outliers?" up to the end of the "Regression Models" subsection. This will give you a solid understanding of the different types of outliers and how they can skew statistical measures like the mean and variance, and consequently, affect model performance.
As you just read, outliers can pull the mean in their direction and inflate the variance and standard deviation. This makes methods that rely on these measures (like linear regression) highly sensitive to them. The two detection techniques we will cover approach this problem from different statistical assumptions.
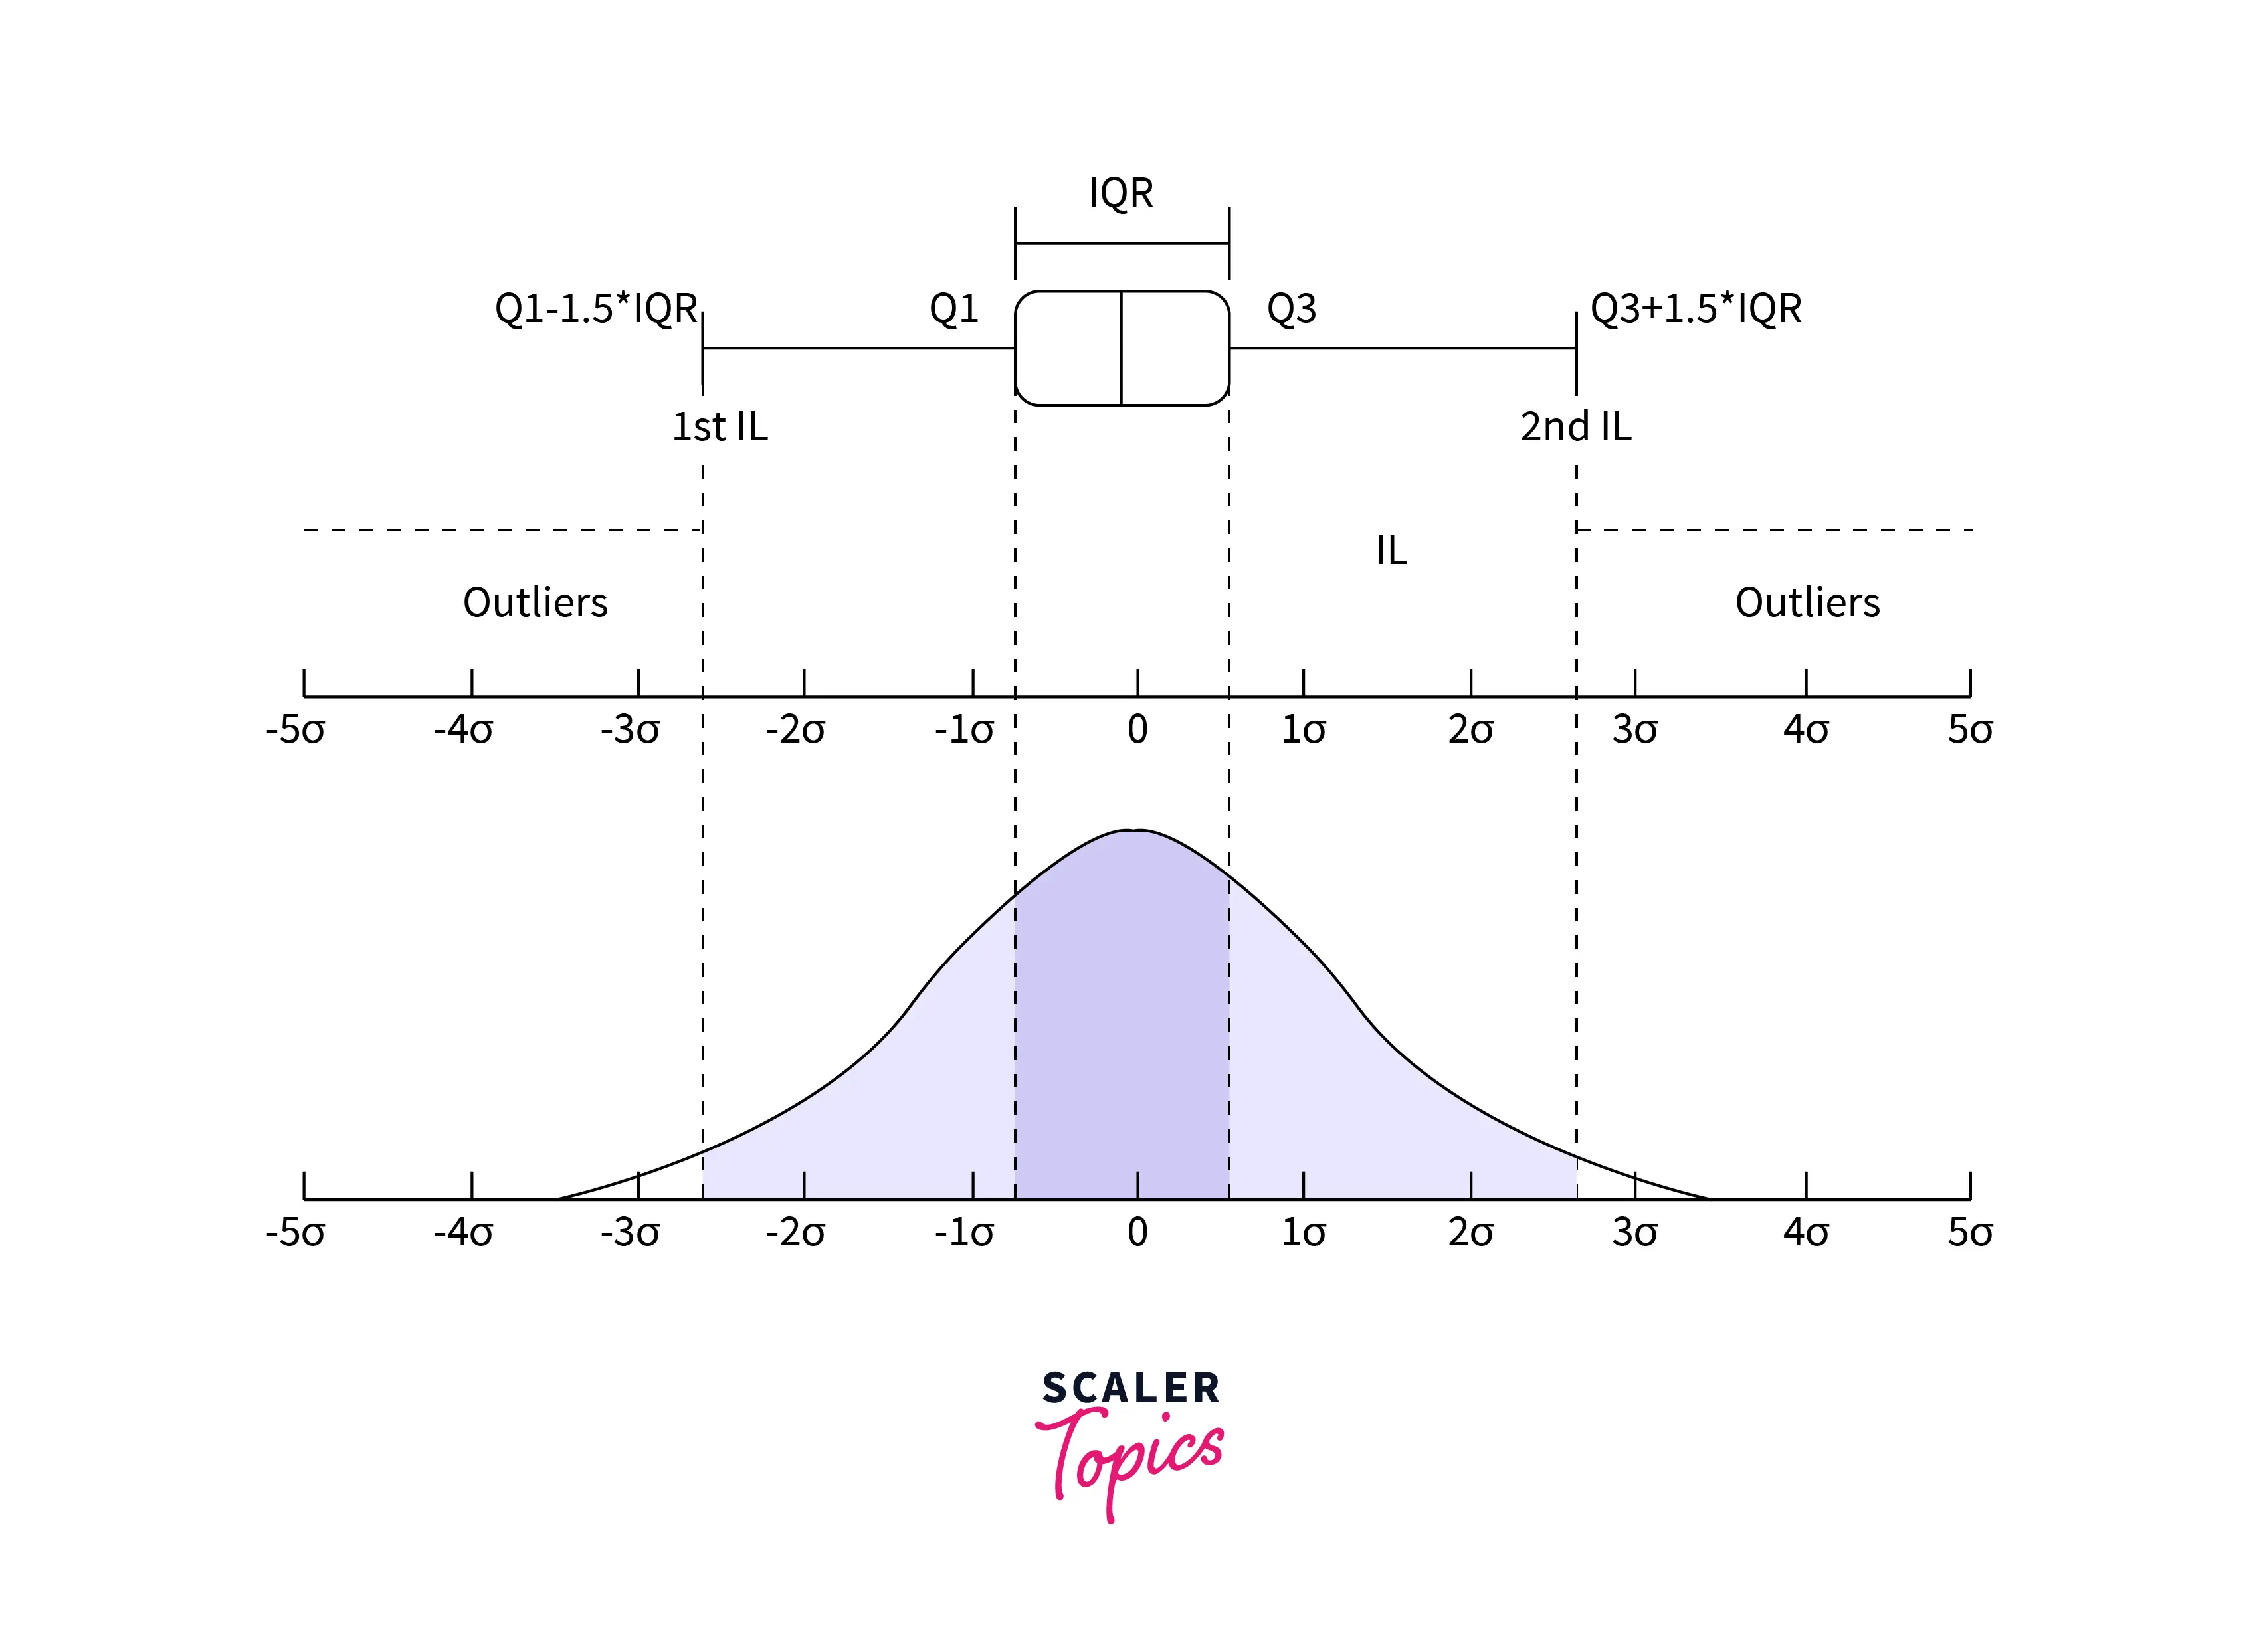
Let's begin with the method tied to the normal distribution: the Z-score.
1. Z-Score Method: A Parametric Approach
The Z-score method measures how many standard deviations a data point is from the mean. It's a parametric method because it assumes the data is approximately normally distributed.
The formula for the Z-score is:
where is the data point, is the mean of the distribution, and is the standard deviation.
For a normal distribution, we know that:
- ~68% of the data falls within 1 standard deviation of the mean.
- ~95% of the data falls within 2 standard deviations.
- ~99.7% of the data falls within 3 standard deviations.
A common rule of thumb is to consider any data point with a Z-score greater than 3 or less than -3 as an outlier. These points are rare and lie far from the bulk of the data.
The codebasics channel has a very clear tutorial on implementing this with Python and pandas.
Outlier detection and removal: z score, standard deviation | Feature engineering tutorial python # 3
This video provides a practical demonstration of using standard deviation and Z-score to find outliers.
Watch the following segments to see how this works in practice: Mean and Standard Deviation: Understand how these are calculated and what they represent. Setting Limits: See how to define upper and lower bounds using the 3-standard-deviation rule. Z-Score Calculation: Learn how to calculate a Z-score for each data point and add it as a new column in a DataFrame. Filtering with Z-Score: Observe how to use the Z-score column to filter out the outliers, achieving the same result as the standard deviation method.
Limitations of the Z-Score Method
The Z-score method has one significant drawback: the mean and standard deviation are themselves sensitive to outliers. A very extreme outlier can inflate the standard deviation and pull the mean towards it, making it harder to detect other, less extreme outliers. For this reason, it's most effective when you have a dataset that is already close to a normal distribution and you don't expect many extreme outliers.
2. Interquartile Range (IQR) Method: A Robust Approach
The IQR method is a more robust alternative that does not assume a specific data distribution. It defines outliers based on the data's quartiles.
- First Quartile (Q1): The 25th percentile of the data.
- Third Quartile (Q3): The 75th percentile of the data.
- Interquartile Range (IQR): The distance between Q3 and Q1, i.e., . This range contains the middle 50% of the data.
Outliers are identified using "fences" calculated from the IQR.
- Lower Fence:
- Upper Fence:
Any data point that falls below the lower fence or above the upper fence is considered an outlier.
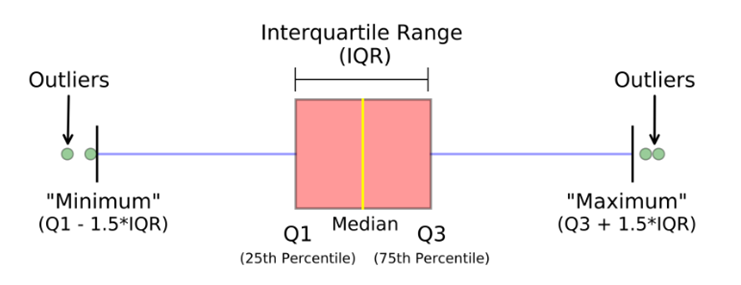
Because this method relies on quartiles and the median (which is Q2), it is not influenced by extreme values, making it "robust."
Detecting And Treating Outliers In Python - Part 1
This article from Towards Data Science gives a great explanation of Tukey's box plot method, which is the formal name for the IQR method.
Read the section titled "Tukey's box plot method". Pay close attention to the formulas for the inner and outer fences and the discussion on its robustness. The article also introduces the concept of "possible" (1.5 * IQR) vs. "probable" (3 * IQR) outliers, which is a useful distinction.
Now, let's see how to implement this in Python. Krish Naik's tutorial provides a concise walkthrough.
Statistics-Finding Outliers in Dataset using Z- score and IQR
This video covers both Z-score and IQR methods, but we will focus on the IQR implementation.
Watch these two segments: IQR Concept: A clear conceptual breakdown of percentiles and how the IQR is calculated. IQR Implementation: A step-by-step guide to calculating Q1, Q3, the IQR, and the upper/lower bounds in Python to find outliers.
Z-Score vs. IQR: A Quick Comparison
| Feature | Z-Score Method | IQR Method |
|---|---|---|
| Underlying Assumption | Data is approximately normally distributed. | No assumption about the distribution (non-parametric). |
| Robustness | Not robust. Sensitive to extreme values. | Robust. Not affected by outliers. |
| Primary Statistics | Mean and Standard Deviation | Median and Quartiles |
| Best For | Clean, bell-shaped data where outliers are rare. | Skewed data or data where outliers are expected. |
Practical Application
Let's apply both methods to a sample dataset to see them in action.
import pandas as pd
import numpy as np


# Sample data with some clear outliers (1, 150)
data = [25, 28, 29, 30, 32, 33, 33, 34, 35, 36, 38, 40, 1, 150]
df = pd.DataFrame(data, columns=['values'])


# --- Z-Score Method ---
mean = df['values'].mean()
std = df['values'].std()
z_score_threshold = 3

df['z_score'] = (df['values'] - mean) / std
z_score_outliers = df[np.abs(df['z_score']) > z_score_threshold]

print("--- Z-Score Method ---")
print(f"Mean: {mean:.2f}, Std Dev: {std:.2f}")
print("Outliers detected:")
print(z_score_outliers)
print("-" * 25)


# --- IQR Method ---
Q1 = df['values'].quantile(0.25)
Q3 = df['values'].quantile(0.75)
IQR = Q3 - Q1
lower_fence = Q1 - 1.5 * IQR
upper_fence = Q3 + 1.5 * IQR

iqr_outliers = df[(df['values'] < lower_fence) | (df['values'] > upper_fence)]

print("\n--- IQR Method ---")
print(f"Q1: {Q1}, Q3: {Q3}, IQR: {IQR}")
print(f"Lower Fence: {lower_fence}, Upper Fence: {upper_fence}")
print("Outliers detected:")
print(iqr_outliers)
print("-" * 25)
Running this code, you'll notice the Z-score method only flags 150 as an outlier. The extreme value of 150 inflates the standard deviation so much that the other outlier, 1, now falls within the 3-sigma limit. In contrast, the IQR method, being robust, successfully identifies both 1 and 150 as outliers. This is a powerful demonstration of why the IQR method is often preferred in practice.
Conclusion
You have now learned how to detect univariate outliers using two foundational statistical techniques. This is a vital skill in preparing data for machine learning.
Here are the key takeaways from this lesson:
- Outliers are data points that significantly differ from other observations and can distort statistical measures and model performance.
- The Z-Score method is a simple, parametric approach that identifies outliers based on their distance from the mean in units of standard deviation. It works best for normally distributed data and is sensitive to the very outliers it aims to find.
- The IQR method is a non-parametric, robust technique that identifies outliers based on their position relative to the central 50% of the data. It is generally the safer and more reliable choice, especially for skewed data.
Now that we can confidently detect outliers, the next step is to decide what to do with them. In our next lesson, we will explore common strategies for handling outliers, including removal, transformation, and capping.