Welcome to the second module of our course. In our previous discussions, we established why data needs careful preparation by exploring common quality issues like outliers and missing values. Now, we begin our journey into descriptive statistics, the set of tools we use to summarize and understand the fundamental characteristics of a dataset.
This lesson marks our first step into quantifying data. We will focus on the most fundamental summary statistics: measures of central tendency. You will learn to calculate and interpret the mean, median, and mode of a dataset. These three measures each provide a different answer to the simple question, "What is the 'center' or 'typical' value of my data?" Understanding their individual strengths and weaknesses is a foundational skill for any data scientist.
What is Central Tendency?
Before we dive into calculations, let's clarify the concept. A measure of central tendency is a single value that attempts to describe a set of data by identifying a central position within that set. It provides a concise summary, a single number that represents the "average" or "most typical" observation.
The Scribbr article "Central Tendency" provides a succinct introduction to the three measures we will cover.
Central Tendency | Understanding the Mean, Median & Mode
This article provides clear, formal definitions of the core concepts for this lesson.
Please read the brief introductory paragraphs, starting from the beginning and ending just before the "Table of contents." Pay attention to the one-sentence definition for each of the three measures.
Now, let's explore each of these measures in detail, focusing on how to calculate them and, more importantly, what they truly represent.
The Mean: The Arithmetic Average
The mean is what people most commonly refer to as the "average." It is the sum of all values in a dataset divided by the number of values. Given your background in computer science, you'll appreciate the formal notation.
In statistics, we distinguish between a population (the entire group of interest) and a sample (a subset of the population). The calculation is the same, but the notation differs:
- Population Mean (): , where is the sum of all values in the population and is the number of values in thepopulation.
- Sample Mean (): , where is the sum of all values in the sample and is the number of values in the sample.
For example, for the dataset {2, 4, 6, 8, 10}, the mean is:
The mean includes every value in its calculation, which makes it comprehensive. However, this property is also its greatest weakness: it is highly sensitive to outliers.
The following video from the codebasics channel uses a brilliant example from a data science perspective to illustrate this exact problem.
Median, Mean, Mode, Percentile | Math, Statistics for data science, machine learning
This video frames the concept of mean and its pitfalls in a practical decision-making context that is highly relevant to data science.
Watch the section from the start of the income example until the introduction of the median, from the car showroom scenario. Notice how a single outlier dramatically changes the mean and leads to a poor conclusion.
As the video showed, the presence of one extremely high income (an outlier) skewed the mean to a value that was not at all representative of the town's general population. This is a critical concept in data analysis. Relying solely on the mean can be misleading.
The Median: The Robust Middle Ground
When our data has outliers or is skewed, the median often provides a better sense of the central value. The median is the middle value in a dataset that has been sorted in ascending order. It is robust because it depends on the position of values, not their magnitude.
To find the median:
- Sort the data from smallest to largest.
- If the number of observations () is odd, the median is the middle value, at position .
- If the number of observations () is even, the median is the average of the two middle values, at positions and .
Let's see this in practice with the excellent guide from Scribbr.
Central Tendency | Understanding the Mean, Median & Mode
This section provides clear, step-by-step examples for calculating the median for both odd- and even-sized datasets.
Read the section on the Median. Start with the definition and work through the examples for an odd-numbered dataset and an even-numbered dataset.
The true power of the median becomes apparent in data science applications. In the previous lesson, we discussed handling missing data. The median provides a much safer way to impute (fill in) missing numerical values than the mean, precisely because it isn't affected by outliers.
The same codebasics video provides a perfect illustration of this use case.
Median, Mean, Mode, Percentile | Math, Statistics for data science, machine learning
This part of the video explains how to find the median and then demonstrates its practical application in data preprocessing.
First, watch the explanation of how to calculate the median for both odd and even datasets from "what we should do here". Then, watch the next section on handling missing values, which shows why using the median to fill in missing income data is a much better strategy than using the mean in the presence of an outlier.
The Mode: The Most Frequent Occurrence
The final measure of central tendency is the mode. It is simply the value that appears most frequently in a dataset.
- A dataset can have one mode (unimodal), two modes (bimodal), or more (multimodal).
- If all values appear with the same frequency, the dataset has no mode.
The mode is the only measure of central tendency that can be used for categorical data (e.g., "Mexican" food in the video example), but it can also be used for numerical data.
Median, Mean, Mode, Percentile | Math, Statistics for data science, machine learning
The video gives a very intuitive and simple explanation of the mode.
Watch the short segment explaining the mode, from "what the heck is mode".
However, the mode has significant limitations, especially with continuous numerical data. It might not be unique, and it might not be representative of the center of the data at all.
Mean, Mode and Median - Measures of Central Tendency
The Laerd Statistics guide gives a good overview of the mode and its problems.
Read the section on the Mode. Pay attention to the example showing how the mode is useful for categorical data. Then, carefully read about the two main problems: having multiple modes or no mode, and when the mode is not representative of the data's center.
The Relationship Between Mean, Median, and Mode
The most insightful analysis comes not from looking at these measures in isolation, but from comparing them. The relationship between the mean, median, and mode reveals the skewness of a dataset's distribution.
- Symmetrical Distribution (e.g., Normal Distribution): The mean, median, and mode are all equal or very close. The data is balanced around the central point.
- Positively Skewed Distribution (Right Skew): There is a long "tail" of high-value outliers. These outliers pull the mean to the right. In this case: Mean > Median > Mode. A classic example is income data, where a few very high earners pull the mean income up.
- Negatively Skewed Distribution (Left Skew): There is a long "tail" of low-value outliers. These pull the mean to the left. In this case: Mean < Median < Mode. An example might be the age of retirement, where most people retire around 65-70, but some retire much earlier, pulling the mean down.
This image provides a perfect visual summary of these relationships.
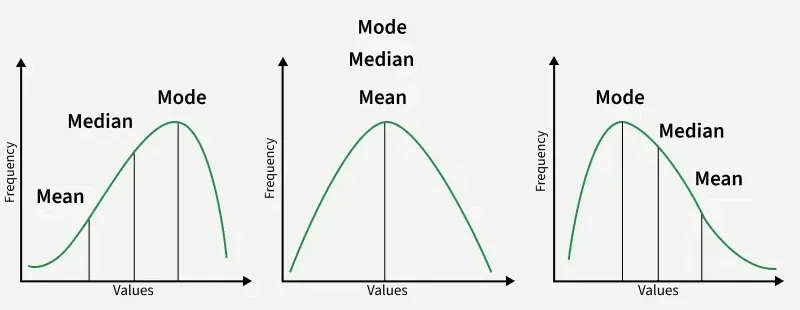
Understanding this relationship is crucial for interpreting your data. If someone reports a mean that is significantly higher than the median, you should immediately suspect the data is positively skewed and that the mean might not be the most representative measure of the "typical" value.
Conclusion
In this lesson, we have taken our first steps in descriptive statistics by learning to calculate and interpret the three measures of central tendency. This is a foundational skill for summarizing any dataset you encounter.
Key Takeaways:
- Mean: The arithmetic average. It is comprehensive but highly sensitive to outliers. Use the notation for a population and for a sample.
- Median: The middle value of a sorted dataset. It is robust to outliers and often a better representation of the center in skewed data. It's also a valuable tool for data preprocessing tasks like imputation.
- Mode: The most frequent value. It is the only measure suitable for categorical data but can be misleading or uninformative for continuous numerical data.
- Interpretation through Comparison: The relative positions of the mean, median, and mode reveal the shape (skewness) of your data's distribution, providing deeper insight than any single measure alone.
You now know how to calculate these three measures and what they tell you about a dataset. In our next lesson, we will build directly on this knowledge to establish clear guidelines for selecting the most appropriate measure of central tendency based on the type of data you have and the shape of its distribution.