Hello! Welcome to your next lesson in the "Strategic AI Toolkit" module.
In our last lesson, we focused on transforming you into a power-researcher with Perplexity AI, mastering how to get fast, verifiable, and sourced answers. But research is only half the battle. To be effective in your corporate role or a startup, you need to communicate your findings and ideas compellingly.
Today, we bridge that gap. The learning outcome is to use specialized AI tools to rapidly generate visual assets like slides, diagrams, and flowcharts from text descriptions. We'll move from the raw text you get from research to polished, professional visuals that make your points land with impact.
We'll explore two categories of tools:
- Presentation Generators: AI that builds an entire slide deck from an outline.
- Diagramming Tools: AI that creates specific flowcharts, mind maps, and other visuals from a text description.
1. From Outline to Presentation: Gamma AI
Staring at a blank PowerPoint or Google Slides screen can be one of the biggest hurdles to productivity. Presentation generators tackle this head-on. You provide the content as a prompt or an outline, and the AI handles the design, layout, and initial visual concepts. One of the most popular tools in this space is Gamma.
The most effective way to use Gamma is not to give it a vague topic, but to provide a structured outline. You can generate this outline using a tool like Gemini Pro, based on the research you conducted with Perplexity.
This video from Jeff Su provides an excellent real-world demonstration of this workflow. You'll see how to take structured text and instantly turn it into a well-designed presentation, which you can then refine.
Why 90% of AI Presentations Fail (do this instead)
This video, 'Why 90% of AI Presentations Fail (do this instead),' demonstrates a powerful three-step workflow. We'll focus on the final two steps: structuring an outline and using Gamma to design the presentation.
Please watch the following segments: The Structure Phase (02:58 - 04:48): See how a detailed research report is converted into a structured, eight-slide outline using a chatbot. This is the 'text' we'll feed into the visual generator. The Design Phase (04:48 - 06:28): This is the core of the process. Watch how the outline is pasted into Gamma to generate an entire presentation in about a minute. Editing & Refining (06:28 - 10:21): This part is crucial. Pay attention to how the AI-generated draft is edited—changing titles, layouts, images, and text. This highlights that AI is a starting point, not the final product.
As the video emphasizes, the goal is not to cede control to the AI but to use it as a powerful assistant to overcome initial friction and handle the time-consuming aspects of design.
To get a more structured overview of Gamma's features and ideal use cases, the following article is a helpful reference.
Create Slides Fast with Gamma AI
The article 'Create Slides Fast with Gamma AI' provides a concise summary of the tool's capabilities, limitations, and target users.
Please read the sections titled 'What Makes Gamma So Powerful?' and 'Who Should Use Gamma AI for Presentations?'. This will give you a clear picture of its strengths and where it fits into a professional workflow.
2. Crafting Specific Diagrams and Flowcharts
Sometimes you don't need a full presentation; you just need a single, clear diagram to explain a complex process, system, or idea. This is where specialized text-to-diagram tools shine. They can create everything from process flowcharts to organizational charts and conceptual mind maps.
The landscape of these tools is vast, but we'll focus on a few distinct types that leverage AI in different ways.
For Instant Visuals from Text: Napkin AI
Napkin AI is designed for speed and simplicity. You paste in a block of text—like meeting notes or a paragraph from a report—and it automatically suggests various diagram formats to visualize that information.
This video provides a quick and effective demonstration of its core power.
Create McKinsey Visuals and Charts in SECONDS for FREE! (Mind-Blowing AI Hack 🤖)
In 'Create McKinsey Visuals and Charts in SECONDS for FREE!', you'll see how Napkin AI can transform unstructured text into clean, professional diagrams.
Watch these two short clips: Core Functionality (02:09 - 03:09): See how pasting text instantly generates a variety of diagram options to choose from. Practical Workflow (05:24 - 06:21): This segment shows a great workflow: summarizing a long transcript with ChatGPT and then using Napkin to visualize the key summary points.
Napkin is excellent when you have the information but aren't sure of the best way to visualize it, as it gives you multiple creative options instantly.
For Collaborative Process Mapping: Miro AI
Miro is a widely used collaborative online whiteboard in many corporate and startup environments. While it's known for brainstorming and workshops, it now includes powerful AI features for diagramming. You can describe a process in plain English, and Miro will generate a detailed flowchart, often including swimlanes for different roles, which is perfect for business process mapping.
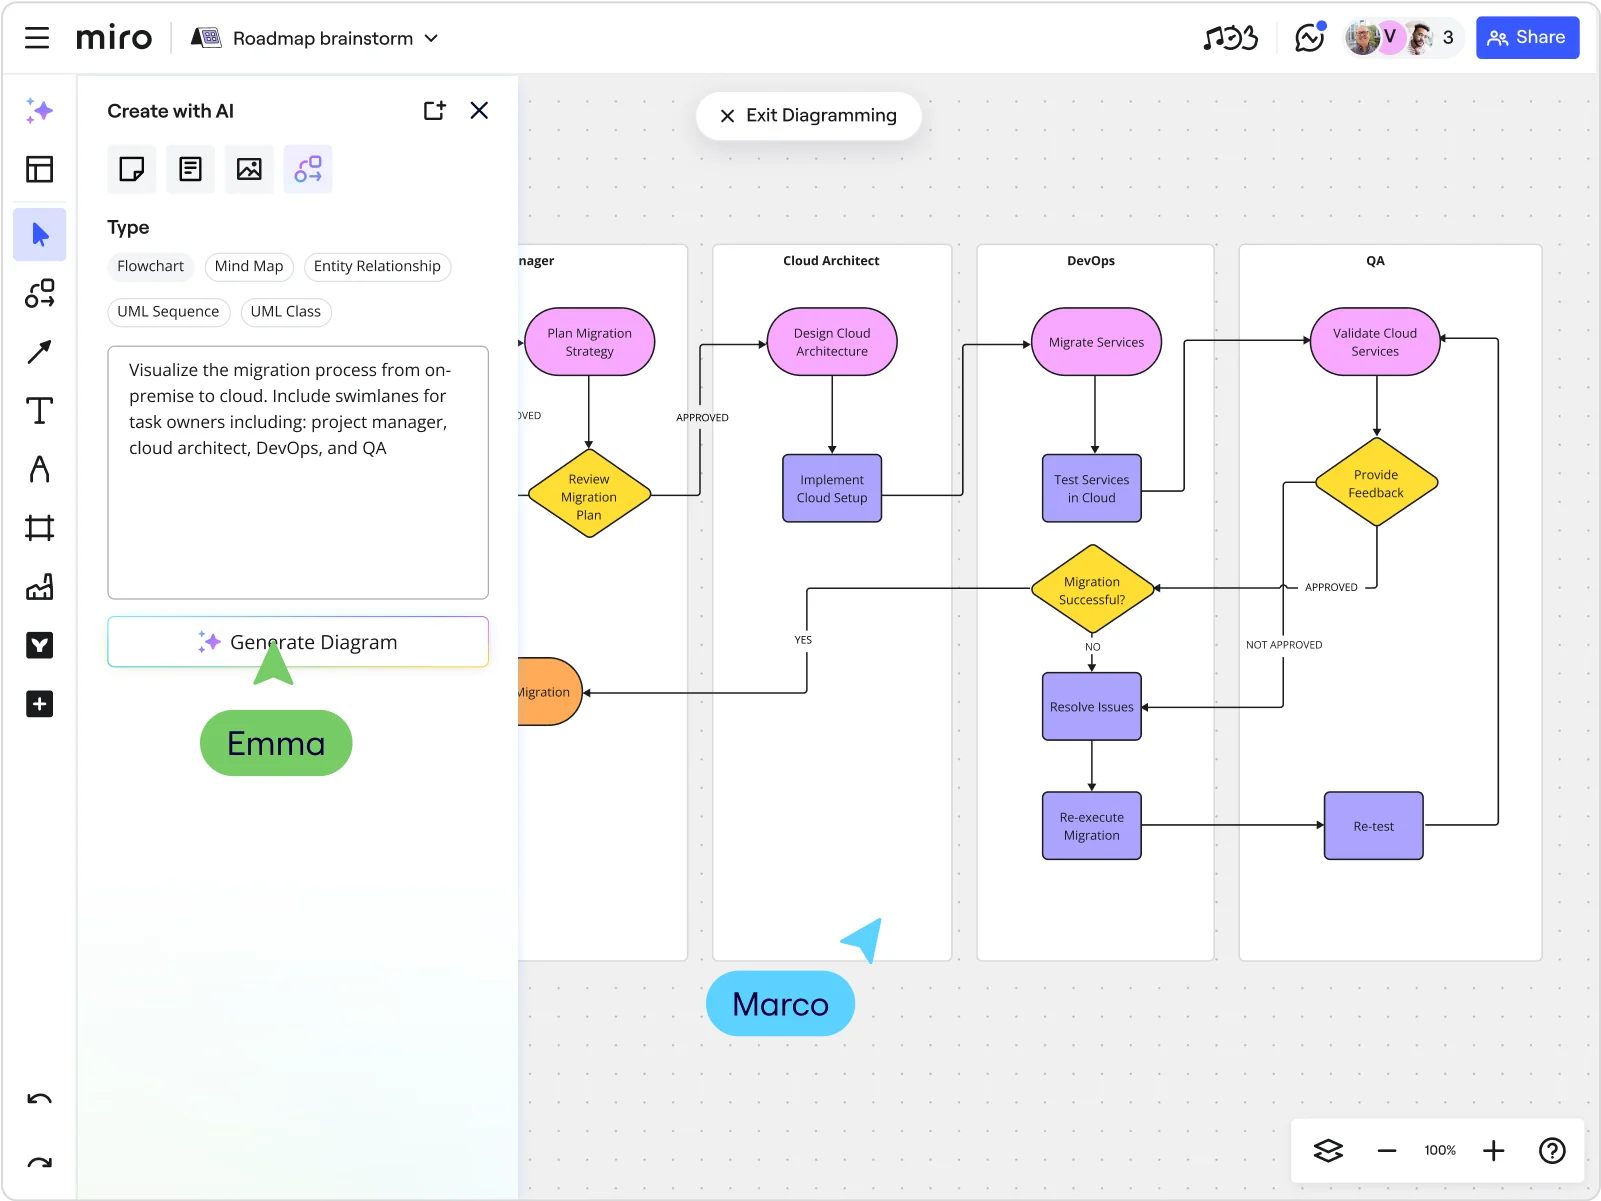
Miro's strength lies in its combination of AI generation and a powerful, collaborative editing canvas. It's ideal for team projects where you might draft a process with AI and then have colleagues refine it in real-time.
For Programmers and Technical Diagrams: Mermaid Chart
Given your background in programming, you'll appreciate this paradigm: diagrams as code. Mermaid is a simple, text-based syntax (similar to Markdown) for defining charts and diagrams. You write a few lines of text describing the nodes and connections, and it renders a clean diagram.
This approach is extremely efficient for technical documentation and for anyone who is comfortable with a code-like syntax. It's also great for version control, as you're just managing text files.

Many platforms, including GitHub and Notion, have native support for Mermaid, so you can embed these text-based diagrams directly into your documentation. While you can write the syntax by hand, tools like Mermaid Chart also include an AI assistant to generate the syntax from a plain-English prompt.
3. Your Integrated Workflow: From Idea to Visual
Now, let's tie this all together into a repeatable workflow you can use for work or your startup projects.
- Gather & Synthesize Text: Start with your raw information. This could be research findings from Perplexity, a business process you've outlined, or key features for a product prototype. Use a tool like Gemini Pro to help you structure this information into a clear outline or a set of bullet points.
- Choose Your Tool for the Job:
- Need a full slide deck? Paste your outline into Gamma.
- Need a specific flowchart or process map for a report or a single slide? Use Miro AI for a collaborative canvas or Mermaid if you prefer a code-based approach.
- Have a block of text and want creative visualization ideas? Paste it into Napkin AI.
- Refine and Customize: This is the most important step. AI tools provide an excellent "first draft" that can save you hours of work. But your expertise is needed for the final 20%. Review the generated content, correct any errors, refine the wording, and adjust the visuals to match your specific message and audience.
4. Practice Exercise
Let's put this workflow into practice with a task relevant to your background.
Scenario: You want to propose a new, automated financial reporting process for your team to reduce manual effort.
Your Task:
-
Create a Flowchart: The process is as follows:
- Data is automatically pulled daily from a financial database via an API.
- A Python script runs to clean and format the data.
- The script generates a summary report in PDF format.
- The PDF report is automatically emailed to a list of stakeholders.
- If the script fails, an error notification is sent to the finance-tech team.
Use a diagramming tool of your choice (e.g., Miro, Mermaid, or another tool you find) to create a flowchart that visually represents this entire process.
-
Draft a Pitch Presentation: Now, you need to pitch this idea to your manager. The presentation should have 3 simple slides:
- Slide 1: Title - Pitching the New Automated Reporting Process
- Slide 2: The Problem vs. Our Solution (here you would notionally embed the flowchart you created)
- Slide 3: Key Benefits (e.g., time saved, accuracy) and Next Steps
Use Gamma to generate a draft of this 3-slide presentation from a text prompt or an outline.
Completing this exercise will solidify your ability to choose the right visual AI tool for a specific task and integrate it into a practical workflow.
Conclusion
You've now added a powerful set of visual AI tools to your arsenal. You can go from raw text to compelling slides and diagrams in minutes, a skill that is a significant productivity multiplier in any professional setting.
Key Takeaways:
- Presentation generators like Gamma are best for creating full slide decks from structured outlines.
- Specialized diagramming tools like Napkin, Miro, and Mermaid are used to create specific visual assets for inclusion in reports, documents, or presentations.
- The most effective workflow involves using AI to create a strong first draft, followed by human refinement and customization to ensure accuracy and impact.
- For technical processes, a "diagrams as code" approach with Mermaid can be exceptionally efficient, leveraging your programming skills.
Next Up:
You now have a growing collection of powerful AI tools—Gemini Pro, Perplexity, Gamma, and more. But how do you decide which one to use for a given task? In our next lesson, we will develop a framework for deciding when Gemini Pro is necessary versus when a free alternative is sufficient, helping you build a strategic and cost-effective AI toolkit.