Welcome to the final lesson of our first module. In our previous session, you successfully built an analytical framework around our logistics simulation, calculating baseline performance metrics under ideal network conditions. This gave us a "best-case scenario" benchmark for our gate-in process. However, enterprise systems, especially those deployed in complex environments like a port, rarely operate under ideal conditions.
This lesson directly addresses that reality by introducing you to the principles of Chaos Engineering. We will focus on a powerful tool called Toxiproxy to deliberately and controllably inject network problems into our system. Your goal is to set up Toxiproxy to intercept the communication between your Camunda worker and the mock Navis N4 API, and then programmatically add latency. By doing this, you'll be able to measure exactly how network degradation impacts the performance metrics you just established, turning an abstract risk into a quantifiable system behavior.
From Ideal to Real: An Introduction to Chaos Engineering
Chaos Engineering is the discipline of experimenting on a system to build confidence in its capability to withstand turbulent conditions in production. Instead of waiting for failures to happen, we proactively cause them in a controlled environment. This allows us to identify and fix weaknesses before they impact real-world operations.
A key aspect of this is simulating network failures. In a distributed system, services communicate over a network that can be slow, unreliable, or completely unavailable. Your experience designing firewall and router rules has given you a deep appreciation for the network as a critical, and often fragile, component of system architecture.
Toxiproxy is a TCP proxy designed by Shopify specifically for this purpose. It acts as an intermediary, sitting between your application and its dependencies, giving you a control panel to manipulate network traffic.
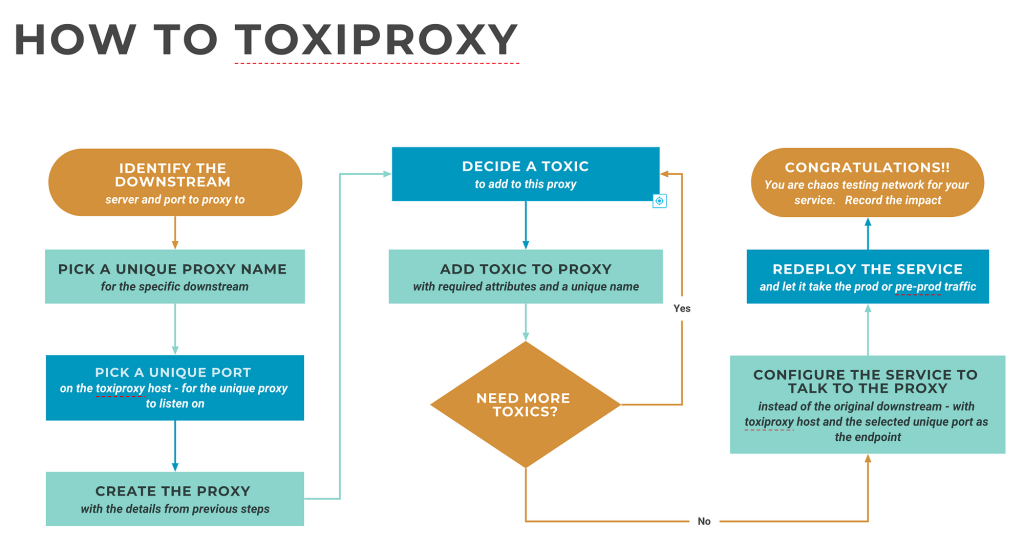
The core concept is simple yet powerful. Instead of your service connecting directly to a dependency, it connects to a Toxiproxy port. Toxiproxy then forwards the traffic to the actual dependency. Once this proxy is in place, you can apply "toxics"—rules that inject failures like latency, connection drops, or bandwidth limits.
The following article gives a concise overview of this mechanism.
How to Use Docker for Chaos Engineering with Toxiproxy
This article provides an excellent conceptual introduction to Toxiproxy.
Focus on the section How Toxiproxy Works. The diagram and accompanying text clearly illustrate how the application is re-routed to connect to Toxiproxy, which then forwards traffic to the upstream service. This is the fundamental pattern we will implement.
Setting Up Your Test Environment
To simulate our full workflow, we need three components running concurrently:
- The mock Navis N4 API, which our worker communicates with.
- The Toxiproxy server, which will manage our proxies and toxics.
- Your Camunda External Task Worker (
full_simulation.py), which drives the process.
Let's set them up.
1. The Mock Navis N4 API
Create a new file named navis_api.py and add the following Python code. This simple Flask application will act as our mock Terminal Operating System API.
# navis_api.py
from flask import Flask, jsonify, request
import time
import logging


# Disable Flask's default logging to have cleaner output
log = logging.getLogger('werkzeug')
log.setLevel(logging.ERROR)

app = Flask(__name__)

@app.route('/gate-in', methods=['POST'])
def gate_in():
    """ A mock endpoint to simulate processing a gate-in request. """
    data = request.json
    truck_id = data.get("truck_id", "Unknown")


    # Simulate some internal processing time (e.g., database lookup)
    time.sleep(0.1) # 100ms

    print(f"[Navis API] Processed gate-in for {truck_id}")
    return jsonify({"status": "success", "message": "Gate-in processed"}), 200

if __name__ == '__main__':
    print("[Navis API] Mock Navis N4 API server starting on http://localhost:5001")
    app.run(host='0.0.0.0', port=5001)
Before running it, ensure you have Flask installed (pip install Flask). Then, open a new terminal, navigate to your project directory, and run:python navis_api.py
You should see a message that the server is running on localhost:5001. Keep this terminal open.
2. The Toxiproxy Server
Next, we need to install and run the Toxiproxy server and its command-line interface (toxiproxy-cli).
The article "Testing Redis Circuit Breaker with Toxiproxy" provides clear installation instructions.
Testing Redis Circuit Breaker with Toxiproxy - DEV Community
This guide walks through setting up Toxiproxy and its CLI locally.
Follow the instructions in the "Setup" section. First, read the part on Installing Toxiproxy. If you are not on macOS, you can download the appropriate binaries for your system from the official Toxiproxy GitHub Releases page. Ensure both toxiproxy-server and toxiproxy-cli are in your system's PATH. Next, follow the instructions for Starting the Toxiproxy Server.
After following the guide, you should have the Toxiproxy server running in a second terminal and have confirmed it's active by getting a version number from curl http://localhost:8474/version.
Implementing the Chaos Experiment
With our environment ready, we can now execute the steps from the flowchart: create the proxy, reconfigure our worker, and inject the toxic.
Step 1: Create the Proxy
We will use toxiproxy-cli to create a proxy that listens for traffic and forwards it to our mock API. The following reading provides the exact command structure.
Testing Redis Circuit Breaker with Toxiproxy - DEV Community
This section demonstrates the toxiproxy-cli create command.
Read the subsection Creating a Proxy. We will adapt this command for our navis-api-proxy.
In a new, third terminal, run the following command. This tells Toxiproxy to create a proxy named navis-api-proxy that listens on localhost:13306 and forwards all traffic to the upstream mock API at localhost:5001.
toxiproxy-cli create navis-api-proxy -l localhost:13306 -u localhost:5001
You can verify its creation by running toxiproxy-cli list.
Step 2: Reconfigure the Camunda Worker
Now, we must modify our system to send traffic through the proxy. Open your full_simulation.py file. Locate the start_gate_in_process function and change the URL from the direct API endpoint to the Toxiproxy listener port.
- From:
API_URL = "http://localhost:5001/gate-in"(or similar) - To:
API_URL = "http://localhost:13306/gate-in"
This simple change redirects all API calls from your worker through Toxiproxy, without changing any other application logic.
Step 3: Inject Latency
This is the moment we introduce chaos. We'll add a latency toxic to our proxy. The reading below shows how to do this for a Redis proxy; the command is identical for our use case.
Testing Redis Circuit Breaker with Toxiproxy - DEV Community
This section provides the command for adding a latency toxic.
Focus on the subsection Scenario 2: Add Latency. Pay attention to the toxiproxy-cli toxic add command, its parameters (-t latency), and attributes (-a latency=5000).
Now, run this command in your third terminal to add 1 second (1000ms) of latency to all downstream traffic (i.e., the responses from the API back to your worker).
toxiproxy-cli toxic add navis-api-proxy -t latency --stream downstream -a latency=1000
The command-line interaction will look like this:

Step 4: Measure the Impact
Your setup is complete. You have:
- Terminal 1: Running
navis_api.py. - Terminal 2: Running
toxiproxy-server. - A running Camunda Docker container.
Now, run your full_simulation.py script.
Observe the output. You should notice a tangible slowdown. The print statements in your simulation will appear more slowly, and the log messages from the mock Navis API will be delayed.
Let the simulation complete and examine the final performance report. Compare the new metrics with the baseline you recorded in the previous lesson. You should see a significant increase in the Average Cycle Time, directly attributable to the 1000ms latency we injected into each API call. This demonstrates a core principle: network performance of dependencies is a primary driver of your system's overall performance.
Step 5: Clean Up
To return the system to its normal state, you can remove the toxic. This is crucial for ensuring tests are isolated.
toxiproxy-cli toxic remove navis-api-proxy -n latency_downstream
If you run the simulation again, performance should return to the baseline (plus the minor overhead of the proxy itself).
Conclusion
In this lesson, you took a significant step from simulation to resilience testing. You have successfully configured Toxiproxy to act as a man-in-the-middle for your mock Navis N4 API, programmatically injecting 1000ms of latency. By re-running your performance analysis, you have quantitatively measured the direct impact of network degradation on your system's cycle time. This hands-on experience provides a foundational skill for building and validating robust, enterprise-grade distributed systems that are prepared for the imperfections of real-world networks.
This concludes our first module on simulation and baseline analysis. Having stressed our system's external communication, we will now turn our attention inward. The next module tackles the challenge of managing state consistently across distributed and intermittently connected edge devices. We will begin by implementing a core building block for local-first applications: a conflict-free replicated data type (CRDT) using the automerge library in Python.