Introduction
Welcome back! In our last lesson, we explored the "why" of clustering, establishing it as a powerful unsupervised learning technique for discovering natural groups in your data, with common use cases like customer segmentation and anomaly detection.
Today, we shift from the "why" to the "how." Before you can run a clustering algorithm, you must perform crucial data preparation steps. A clustering model is only as good as the data it's given. This lesson focuses on two of the most important preparation tasks, directly addressing our learning outcome: Prepare data for clustering by selecting appropriate fields and applying scaling.
By the end of this lesson, you will understand the principles for choosing the right variables for your analysis and why and how to scale them so that the algorithm can produce meaningful results.
Part 1: Selecting the Right Fields for Clustering
The first step in preparing your data is deciding which information, or which fields, to include in your analysis. A poor choice of fields will lead to meaningless clusters. There are two main considerations here: the data type and the business relevance.
1. Use Only Numeric Fields
Clustering algorithms like K-Means (which we'll use soon) work by measuring the mathematical distance between data points. To do this, they require numeric data. You cannot calculate the "distance" between non-numeric categories like 'Red' and 'Blue' or between text fields like customer names.
Therefore, you must select fields with numeric data types, such as integers or floating-point numbers (doubles, floats).

If you have a relevant categorical field (e.g., a customer tier like 'Gold', 'Silver', 'Bronze'), you would need to convert it into a numeric format first, for example through one-hot encoding. However, for the scope of the Alteryx Advanced certification, your focus will be primarily on using existing numeric fields.
2. Ensure Business Relevance
Simply choosing all available numeric fields is not a good strategy. The fields you select should be directly related to the business question you are trying to answer.
For example, if your goal is to segment customers based on their purchasing behavior, you should select fields like:
TotalSalesAverageOrderValueNumberOfTransactionsDaysSinceLastPurchase
Including irrelevant fields, such as CustomerID or a numeric PostalCode, would confuse the model. A CustomerID is just an identifier and has no mathematical meaning, while a PostalCode doesn't represent a continuous quantity and would skew the distance calculations unless treated very carefully.
Think about it: If you wanted to group different types of cars, would you use TopSpeed and EngineSize, or LicensePlateNumber and Color? The first two are relevant numeric features for performance-based grouping; the latter two are not.
Part 2: The Importance of Feature Scaling
Once you've selected your relevant numeric fields, you'll likely run into a common problem: your variables have different scales.
Imagine you're clustering customers using two fields:
- Age: ranging from 20 to 75
- Annual Income: ranging from $30,000 to $250,000
The range of Annual Income is vastly larger than the range of Age. When a clustering algorithm calculates the distance between two customers, the difference in income will completely dominate the calculation. The difference in age will become almost irrelevant. This will prevent the algorithm from finding meaningful patterns that involve both variables.
To solve this, we use feature scaling—a process that transforms our data to put all variables on a comparable scale. Let's look at a brief article that introduces this concept.
Normalization, Standardization, and Regularization...
To understand why scaling is so important, let's read an article from the Alteryx Community. It explains how variables with different ranges can cause problems for distance-based algorithms like clustering.
Read the first section titled 'Feature Scaling: Normalization and Standardization', up to (but not including) the 'Min-Max Normalization' subsection. Focus on the example of 'Library Checkouts' vs. 'Average Rating' and why this variation is an issue for some models.
Part 3: How to Scale Your Data
There are two primary methods for scaling data that you need to know for clustering in Alteryx. Both are conveniently built directly into the K-Centroids Cluster Analysis tool.
Let's read about these two methods before we see how they appear in Alteryx.
Normalization, Standardization, and Regularization...
Now that you know why we scale, let's learn about the two primary methods you'll encounter: Standardization and Normalization. This article explains both.
Please read the two subsections: 'Min-Max Normalization' 'Standardization' For each one, focus on understanding how it transforms the data and the key differences between them. Note that what Alteryx calls 'unit interval' corresponds to 'Min-Max Normalization'.
As the article explained, here are the two key methods:
1. Standardization (Z-score)
- What it does: Transforms the data so that it has a mean of 0 and a standard deviation of 1.
- How it works: It subtracts the mean from each data point and then divides by the standard deviation.
- When to use it: This is the most common and generally recommended method for clustering. It is less sensitive to outliers than normalization and works well with algorithms that assume your data is normally distributed (even though K-Means does not strictly require this).
2. Normalization (Unit Interval / Min-Max Scaling)
- What it does: Rescales the data to a fixed range, usually [0, 1]. The smallest value becomes 0, the largest becomes 1, and all other values fall somewhere in between.
- How it works: It subtracts the minimum value from each data point and then divides by the range (max value - min value).
- When to use it: This method is useful but can be heavily influenced by outliers. If you have one extremely high or low value, it can squash all the other data points into a very small range, which might hide their underlying patterns.
Applying Scaling in Alteryx
Fortunately, you don't need to perform these calculations manually. The K-Centroids Cluster Analysis tool has a simple configuration option for this.
Tool Mastery | K-Centroids Cluster Analysis
This brief excerpt from the Alteryx Community's guide on the K-Centroids Cluster Analysis tool explains how to apply scaling directly within the tool's configuration.
Read the paragraph that begins with 'Once you have your combination of clustering variables selected...'. Pay attention to the two options offered: z-score and unit interval.
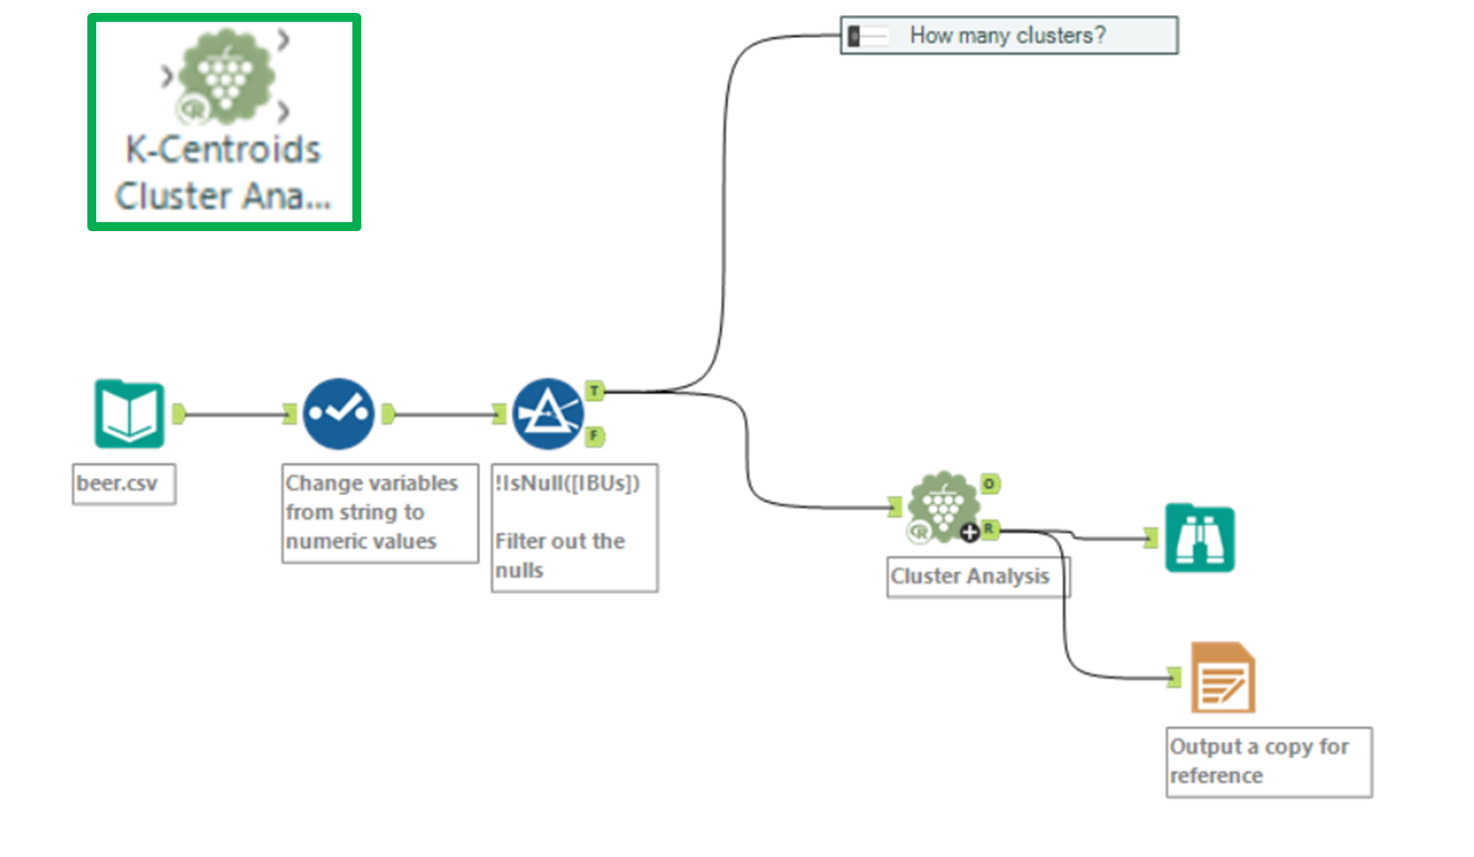
As the text confirms, and as we saw in the image earlier (LINK), the tool provides a checkbox to Standardize the fields. When you check this box, you can choose between:
- z-score (Standardization)
- unit interval (Min-Max Normalization)
For most clustering tasks you'll encounter, selecting z-score is the standard and safest choice.
Conclusion
In this lesson, we covered the critical data preparation steps that precede any clustering analysis. Getting this stage right is more than half the battle in creating meaningful and reliable clusters.
Key Takeaways:
- Field Selection: For clustering, you must use numeric fields that are relevant to the business problem you are trying to solve.
- The Need for Scaling: Feature scaling is essential to prevent variables with large ranges (e.g., income) from dominating the distance calculations and overpowering variables with smaller ranges (e.g., age).
- Scaling Methods:
- Standardization (Z-score): Transforms data to a mean of 0 and a standard deviation of 1. It is the most common and generally recommended method for clustering.
- Normalization (Unit Interval): Scales data to a fixed range, typically [0, 1]. It is more sensitive to outliers.
- Alteryx Implementation: Both Z-score and Unit Interval scaling can be applied with a single click inside the K-Centroids Cluster Analysis tool.
Preview of the Next Lesson:
Now that you know how to choose your fields and prepare them by scaling, you are ready to build your first clustering model. In the next lesson, we will put this knowledge into practice and use the K-Centroids Cluster Analysis tool to build a K-Means clustering model.