Introduction
Welcome back! In our previous lesson, you created the strategic skeleton of the business case for "Project Phoenix" by defining the problem statement, strategic alignment, and key options. You now have a compelling narrative for why a change is needed.
This lesson focuses on adding the financial substance to that narrative. We will address the learning outcome: Estimate the direct and indirect costs and quantify tangible and intangible benefits of a large-scale transformation initiative. A business case without credible numbers is merely an opinion. Your task is to build a financial argument that is as robust as your strategic one.
Given your background in finance, you're already familiar with concepts like ROI and cost-benefit analysis. Our focus here will be on applying those principles to the unique and often ambiguous variables of a large-scale technology and organizational transformation. We'll move beyond standard financial modeling to uncover the hidden costs and multifaceted benefits specific to a B2B software company shifting to microservices and AI.
1. The Anatomy of Transformation Costs: Beyond the Price Tag
The first mistake many organizations make is underestimating the Total Cost of Ownership (TCO). The initial quote from a software vendor or implementation partner is often just the tip of the iceberg. A credible business case must present a realistic, comprehensive view of the total investment required.
Let's start with a video that highlights common challenges and the importance of looking for hidden costs.
How to Create a Business Case for Your Digital Transformation [ROI and Investment Case Analysis 101]
This video from Eric Kimberling, a digital transformation consultant, discusses the common pitfalls organizations encounter when building a business case. It's a great primer on why we need to think beyond the obvious expenses.
Please watch from 01:15 to 02:31 and then from 03:10 to 06:18. Pay close attention to the distinction between vendor-related costs and the broader, non-vendor-related internal and indirect costs.
As the video emphasizes, a realistic cost analysis must be comprehensive. We can categorize these costs into two main types:
- Direct Costs: Expenses directly tied to the project execution.
- One-Time: Software licenses, implementation consulting fees, initial infrastructure setup (e.g., cloud migration), initial team training.
- Recurring: Ongoing software subscriptions, cloud hosting fees, support and maintenance contracts.
- Indirect Costs: Resources consumed by the organization that are not directly billed to the project but are very real. These are often the most underestimated.
- One-Time: Productivity dips during training and deployment, data cleansing and migration efforts.
- Recurring: Time spent by internal subject matter experts, backfilling roles for staff assigned to the transformation, increased operational overhead for managing new systems.
For a transformation like Project Phoenix, which involves moving from a monolith to microservices, the cost breakdown is quite specific.

To make this tangible, let's look at a resource that details the specific costs associated with a microservices migration.
Microservices ROI Explained: Cost, Benefits, and Business Impact
The article 'Microservices ROI Explained' provides a detailed table of cost categories for this exact type of transformation. This will serve as an excellent checklist for Project Phoenix.
Please review the section 'What are the Costs Associated with Microservices?' and carefully study the table. Note how it breaks down costs into categories like Team Restructuring, Migration Engineering, and Additional Personnel.
This table provides a fantastic starting point for your own estimates, covering items like retraining, infrastructure orchestration (Kubernetes), and the crucial need for more DevOps resources on a recurring basis.
2. Quantifying Transformation Benefits: The Full Value Story
Just as costs are multifaceted, so are benefits. A strong business case quantifies not only the obvious cost savings but also the strategic gains that drive future growth. We can group benefits into two categories: tangible and intangible.
- Tangible Benefits: Measurable financial gains that can be directly entered into an ROI calculation. Examples include increased revenue or decreased operational expenses.
- Intangible Benefits: "Softer" gains that are difficult to assign a direct dollar value to but have significant strategic importance. Examples include improved employee morale or enhanced brand reputation.
The video from Eric Kimberling provides a good overview of these categories.
How to Create a Business Case for Your Digital Transformation [ROI and Investment Case Analysis 101]
Let's return to the same video to explore the benefit side of the equation.
Watch from 06:18 to 10:05. Notice the examples provided for both tangible benefits (like inventory reduction or labor savings) and intangible benefits (like better customer experience).
The key to a persuasive business case is to quantify as much as possible, even finding financial proxies for intangible benefits. For a B2B SaaS company undergoing the Project Phoenix transformation, the benefits are directly linked to core business metrics.
Connecting Transformation to SaaS Metrics
Your transformation's success can be directly measured through its impact on key SaaS metrics. A reduction in churn or an increase in expansion revenue are powerful, tangible outcomes. This next video will give us the vocabulary we need.
The video 'Every SaaS Acronym Explained' is a rapid-fire masterclass in SaaS finance. We'll focus on the metrics most impacted by your transformation.
Please watch the following segments: 01:06 - 02:19: Explains Customer Lifetime Value (LTV). 02:19 - 05:18: Explains Churn and its impact. 05:49 - 06:29: Connects LTV and Customer Acquisition Cost (CAC). 08:52 - 10:41: Explains Expansion MRR and negative churn. Focus on how improving your product (via microservices/AI) can directly influence these metrics.
Here is how you connect the dots for Project Phoenix:
- Tangible Benefit: Reduced Churn & Increased LTV.
- Cause: The microservices architecture improves platform stability and reduces downtime. The new AI features provide more value.
- Effect: Customer satisfaction increases, leading to a lower churn rate.
- Quantification: A 1% decrease in monthly churn can lead to a significant increase in the average Customer Lifetime Value (LTV). You can model this financial impact directly.
- Tangible Benefit: Faster Time-to-Market.
- Cause: Autonomous teams can deploy their microservices independently.
- Effect: New features are released in weeks, not quarters.
- Quantification: Calculate the revenue impact of launching, for example, two new enterprise features a year ahead of the competition. The article "Microservices ROI Explained" notes that microservices teams can achieve up to 4x faster deployment speeds.
- Tangible Benefit: Increased Expansion MRR (Negative Churn).
- Cause: The modular nature of microservices allows you to sell individual features or service tiers. The AI layer can be a premium add-on.
- Effect: Existing customers upgrade or purchase new modules, increasing their monthly spend.
- Quantification: Model a 5% increase in expansion MRR from the existing customer base. As the video showed, this can lead to the highly desirable state of "negative MRR churn."
- Intangible Benefit with a Proxy: Increased Developer Productivity.
- Cause: Developers work on smaller, more manageable codebases.
- Effect: Higher job satisfaction, less burnout, more innovation.
- Proxy Metric: While "happiness" is hard to measure, you can track Deployment Frequency (e.g., moving from monthly to weekly deployments) or a reduction in Mean Time to Recovery (MTTR) after an incident. The article "Microservices ROI Explained" suggests this can be reduced from hours to under 50 minutes, directly saving revenue.
To get more ideas for metrics, this guide for CIOs is a valuable resource.
The CIO's Guide to Measuring Digital Transformation ROI
The article 'The CIO's Guide to Measuring Digital Transformation ROI' presents a balanced scorecard approach to measurement, which aligns perfectly with our discussion of tangible and intangible benefits.
Skim the sections on 'Financial Metrics,' 'Operational Metrics,' 'Customer-Centric Metrics,' and 'Strategic & Innovation Metrics.' You don't need to read in-depth, but notice the variety of KPIs you can use to build your case, such as NPS, CLV, Time to Market, and Employee Engagement.
3. Assembling the Financial Picture
Once you have identified your costs and benefits, the final step is to assemble them into a financial summary that executives can easily digest. This typically includes a cash flow projection over several years and key financial metrics.
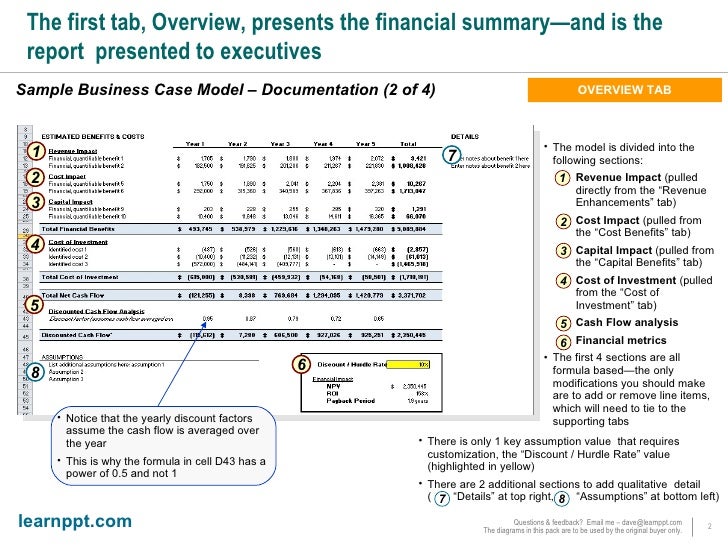
Your finance background means you are well-equipped to build such a model. The challenge, as we've discussed, lies in sourcing credible inputs for a complex transformation.
Application Exercise: Cost-Benefit Analysis for Project Phoenix
Now, let's apply these concepts to Project Phoenix. Your task is to create a high-level list of the key costs and benefits for the transformation. This will form the input for your financial model.
Your Task (15 minutes):
In a document, create two tables: one for costs and one for benefits. For each table, list at least four specific items relevant to Project Phoenix. Use the categories we've discussed. For each item, specify its category and add a brief note on how you would quantify it.
Project Phoenix: Cost-Benefit Analysis (Draft)
Estimated Costs
| Cost Item | Category (Direct/Indirect, One-Time/Recurring) | Quantification Note |
|---|---|---|
| e.g., Kubernetes consulting | Direct, One-Time | Quote from a specialized consulting firm for 3 months of work. |
| 1. | ||
| 2. | ||
| 3. | ||
| 4. |
Estimated Benefits
| Benefit Item | Category (Tangible/Intangible) | Quantification Note / Proxy Metric |
|---|---|---|
| e.g., Improved Brand Image | Intangible | Proxy: Track mentions in industry press; link to lead generation. |
| 1. | ||
| 2. | ||
| 3. | ||
| 4. |
Click here to see a sample answer after you have completed your own.
Project Phoenix: Cost-Benefit Analysis (Sample Answer)
Estimated Costs
| Cost Item | Category (Direct/Indirect, One-Time/Recurring) | Quantification Note |
|---|---|---|
| 1. Migration Engineering | Direct, One-Time | Estimate based on 4 scrum teams (approx. 30 engineers) working for 18 months. |
| 2. Additional DevOps & SRE Personnel | Direct, Recurring | Annual salary for 5 new hires to manage the increased complexity of the microservices environment. |
| 3. Backfilling Internal SMEs | Indirect, Recurring | Cost to hire contractors to cover 50% of the daily work for 10 subject matter experts assigned to the project. |
| 4. Advanced Observability Tooling | Direct, Recurring | Annual license cost for a tool like Datadog or New Relic, scaling with the number of services. |
Estimated Benefits
| Benefit Item | Category (Tangible/Intangible) | Quantification Note / Proxy Metric |
|---|---|---|
| 1. Reduced Customer Churn | Tangible | Model a 1.5% reduction in monthly revenue churn, and calculate the resulting increase in average LTV and total revenue over 3 years. |
| 2. New Revenue from AI Module | Tangible | Project adoption of a new premium AI-powered analytics module by 10% of the customer base within 24 months at a price of $X/month. |
| 3. Reduced Downtime Costs | Tangible | Calculate based on reducing system-wide outages from 2 per year (at 4 hours each) to localized incidents with MTTR < 30 mins. Use average revenue per hour as the basis. |
| 4. Increased Organizational Agility | Intangible | Proxy Metric: Increase in deployment frequency from monthly to on-demand (targeting weekly), demonstrating faster response to market needs. |
Conclusion
Excellent work. You've now moved from the strategic "why" to the financial "how much." By digging deep into the specific costs and benefits of a microservices and AI transformation, you can build a business case that is both ambitious in its vision and credible in its financial justification.
Key Takeaways:
- Total Cost of Ownership (TCO) for a transformation goes far beyond vendor quotes, including significant indirect costs like backfilling internal staff and productivity dips.
- Tangible benefits in a SaaS context should be directly linked to core metrics like Churn, LTV, and Expansion MRR.
- Intangible benefits, like agility or morale, can be quantified using proxy metrics such as deployment frequency or employee retention rates.
- A robust financial model is built on a foundation of well-researched, realistic inputs for both costs and benefits, specific to the nature of the transformation.
Preview of the Next Lesson
You've defined the potential upside of Project Phoenix. However, a credible business case must also soberly assess the downside. Leadership needs to understand not just the potential return, but also the obstacles that could prevent you from achieving it.
In our next lesson, we will focus on how to: Conduct a risk assessment for the transformation initiative and outline mitigation strategies. This will complete the core analytical section of your business case, presenting a balanced and trustworthy view of the path forward.