Introduction
Welcome back. In our last lesson, we confronted the uncertainties of your transformation by conducting a thorough risk assessment for "Project Phoenix." By identifying and planning for potential obstacles, you've made your transformation strategy more robust and realistic.
Now, we shift from managing what could go wrong to defining what must go right. This lesson tackles the learning outcome: Define success criteria and measurable outcomes for a transformation program. We will answer the crucial question, "How will we know if we are succeeding?"
Defining success isn't just about a finish line; it's about creating a guidance system for the entire journey. Clear, measurable outcomes align leadership, motivate teams, justify the significant investment you've calculated, and allow you to track progress transparently. This is the foundation for data-driven decision-making and proving the ultimate value of your transformation.
1. The Language of Measurement: Metrics, KPIs, and Key Results
Before we can measure success, we need a common language. You've likely encountered terms like "metrics," "KPIs," and "Key Results" frequently in your finance and product management roles. While often used interchangeably, they have distinct meanings and purposes. Understanding this distinction is key to building an effective measurement framework.
Let's watch a short video that provides a clear and concise explanation of these core concepts.
The difference between Metrics, KPIs & Key Results
This video from Perdoo clearly distinguishes between metrics, Key Performance Indicators (KPIs), and Key Results. This will help us build a more precise and powerful measurement system.
Watch the video from the beginning until the end (00:00:26 - 06:47). Pay close attention to the specific purpose of each term: a metric measures, a KPI monitors health (business as usual), and a Key Result tracks change towards an objective.
To summarize the key distinctions:
- Metric: A quantifiable measure. It's a number, like Customer Churn Rate or Monthly Active Users.
- KPI (Key Performance Indicator): A metric with a target, used to monitor the ongoing health of a key business area. It tells you if you are performing at the desired level for "business as usual" (BAU). For example: Keep Customer Churn Rate below 2%.
- Key Result (as in OKRs): A measure of progress towards a specific, time-bound objective. It has a start value and a target value, designed to track change. For example: Decrease Customer Churn Rate from 5% to 2% in Q3.
For a transformation program like Project Phoenix, you will primarily be defining Key Results to track the change, while also establishing the new KPIs that will define success in the future "business as usual" state.
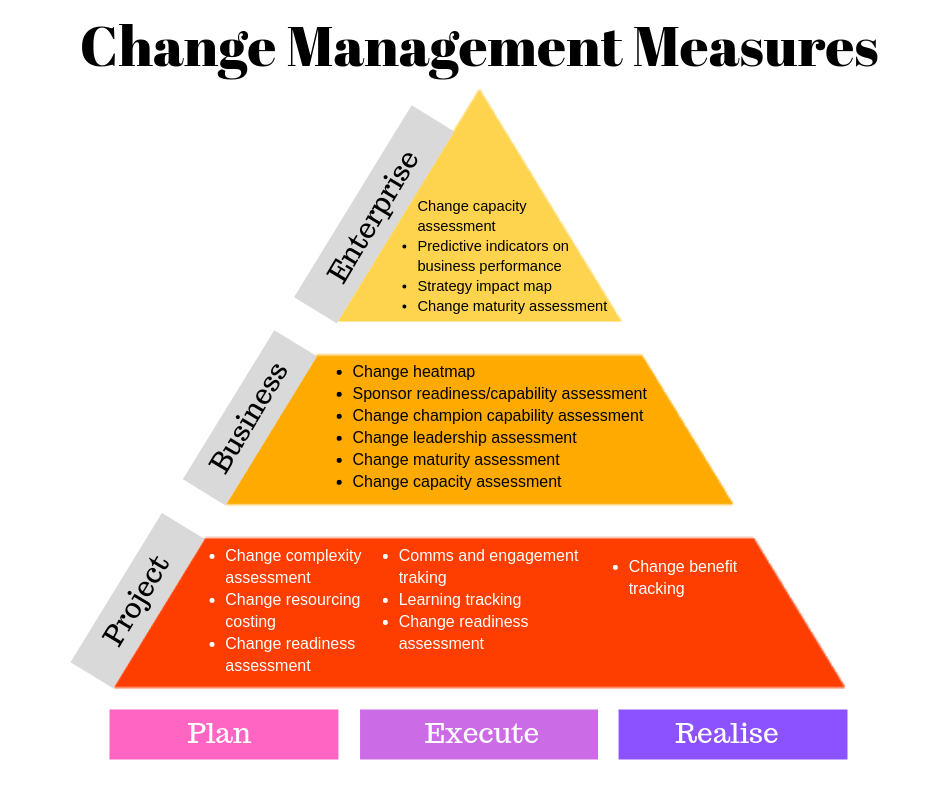
2. A Three-Level Framework for Measuring Success
Defining success for a complex transformation requires a multi-faceted approach. Measuring only the final financial return is insufficient; it's a lagging indicator that tells you nothing about your progress along the way. A comprehensive framework measures the change process itself, the adoption by your people, and the ultimate business outcomes.
The Prosci methodology offers a powerful three-level framework for this.
Metrics for Measuring Change Management
This article from Prosci, 'Metrics for Measuring Change Management,' provides a structured approach to measurement. It's a foundational text for thinking about success in a holistic way.
Please read the section titled '3 Levels of Performance Metrics for Change Management Projects' and its three subsections. Focus on understanding the distinct purpose of each level: change management performance, individual performance, and organizational performance.
This framework gives us three interconnected perspectives on success:
- Change Management Performance: Are we executing the change plan effectively? These are leading indicators that measure the health of the transformation process itself.
- Examples: Completion of sponsor briefings, percentage of employees trained, communication plan milestones met.
- Individual Performance (Adoption & Usage): Are people changing their behaviors and using the new tools/processes? This is the critical "people side" of change and a leading indicator of future business results.
- Examples: Speed of adoption (e.g., number of users on the new system 30 days post-launch), ultimate utilization (% of sales team using the new CRM), and proficiency (reduction in support tickets related to new features).
- Organizational Performance: Did the transformation deliver the expected business value? These are the lagging indicators that connect to the business case you built earlier.
- Examples: Increased revenue, reduced operational costs, improved customer satisfaction (NPS), higher employee engagement.
This layered approach is crucial. If your organizational performance metrics are lagging, you can look at your individual performance metrics to diagnose why. If adoption is low, you can check your change management performance metrics to see if a part of your change plan is failing.
3. Defining Outcomes for Your Transformation Dimensions
Now, let's focus on Level 3: Organizational Performance. Your transformation has four key dimensions: organizational, product/tech, delivery, and GTM. Success criteria must be defined for each.
A powerful way to structure this is by thinking in terms of Financial, Customer-Centric, and Operational outcomes.
The following article from Brixon Group, while lengthy, provides an excellent B2B-centric breakdown of these dimensions. You don't need to read it all, but I've summarized the key points below.
The 15 Critical Metrics for Measurable B2B Success
This article, 'The 15 Critical Metrics for Measurable B2B Success,' is a deep dive into KPIs for B2B companies. While we won't read it all, reviewing the main dimensions of measurement will provide a rich source of potential metrics for Project Phoenix.
Please read the section 'The Three Dimensions of Successful Project Success Measurement' and its three subsections on the Financial, Customer-Centric, and Operational dimensions. This provides a clear structure for categorizing your key outcomes.
Let's apply these dimensions to Project Phoenix:
Financial Outcomes
These directly measure the monetary return and link back to your business case.
- Return on Investment (ROI): The ultimate measure of profitability.
- Total Cost of Ownership (TCO): Crucial for the monolith-to-microservices shift. The goal is likely to reduce TCO over time through more efficient scaling and maintenance.
- Customer Lifetime Value (CLV) & Customer Acquisition Cost (CAC): Your GTM and product changes should aim to increase CLV and decrease CAC.
- Net Revenue Retention (NRR): A key SaaS metric. An NRR > 100% indicates that revenue growth from existing customers (expansion, upsell) outweighs any churn. This is a primary goal for a modular, microservices-based offering.
Customer-Centric Outcomes
These measure the impact on your customers' experience and loyalty. Your GTM transformation will be heavily measured here.
- Net Promoter Score (NPS): Measures customer willingness to recommend your product.
- Adoption Rate: Percentage of customers using the new modular features.
- Customer Effort Score (CES): How easy is it for customers to get value from your product?
- Customer Churn Rate: The percentage of customers who leave.
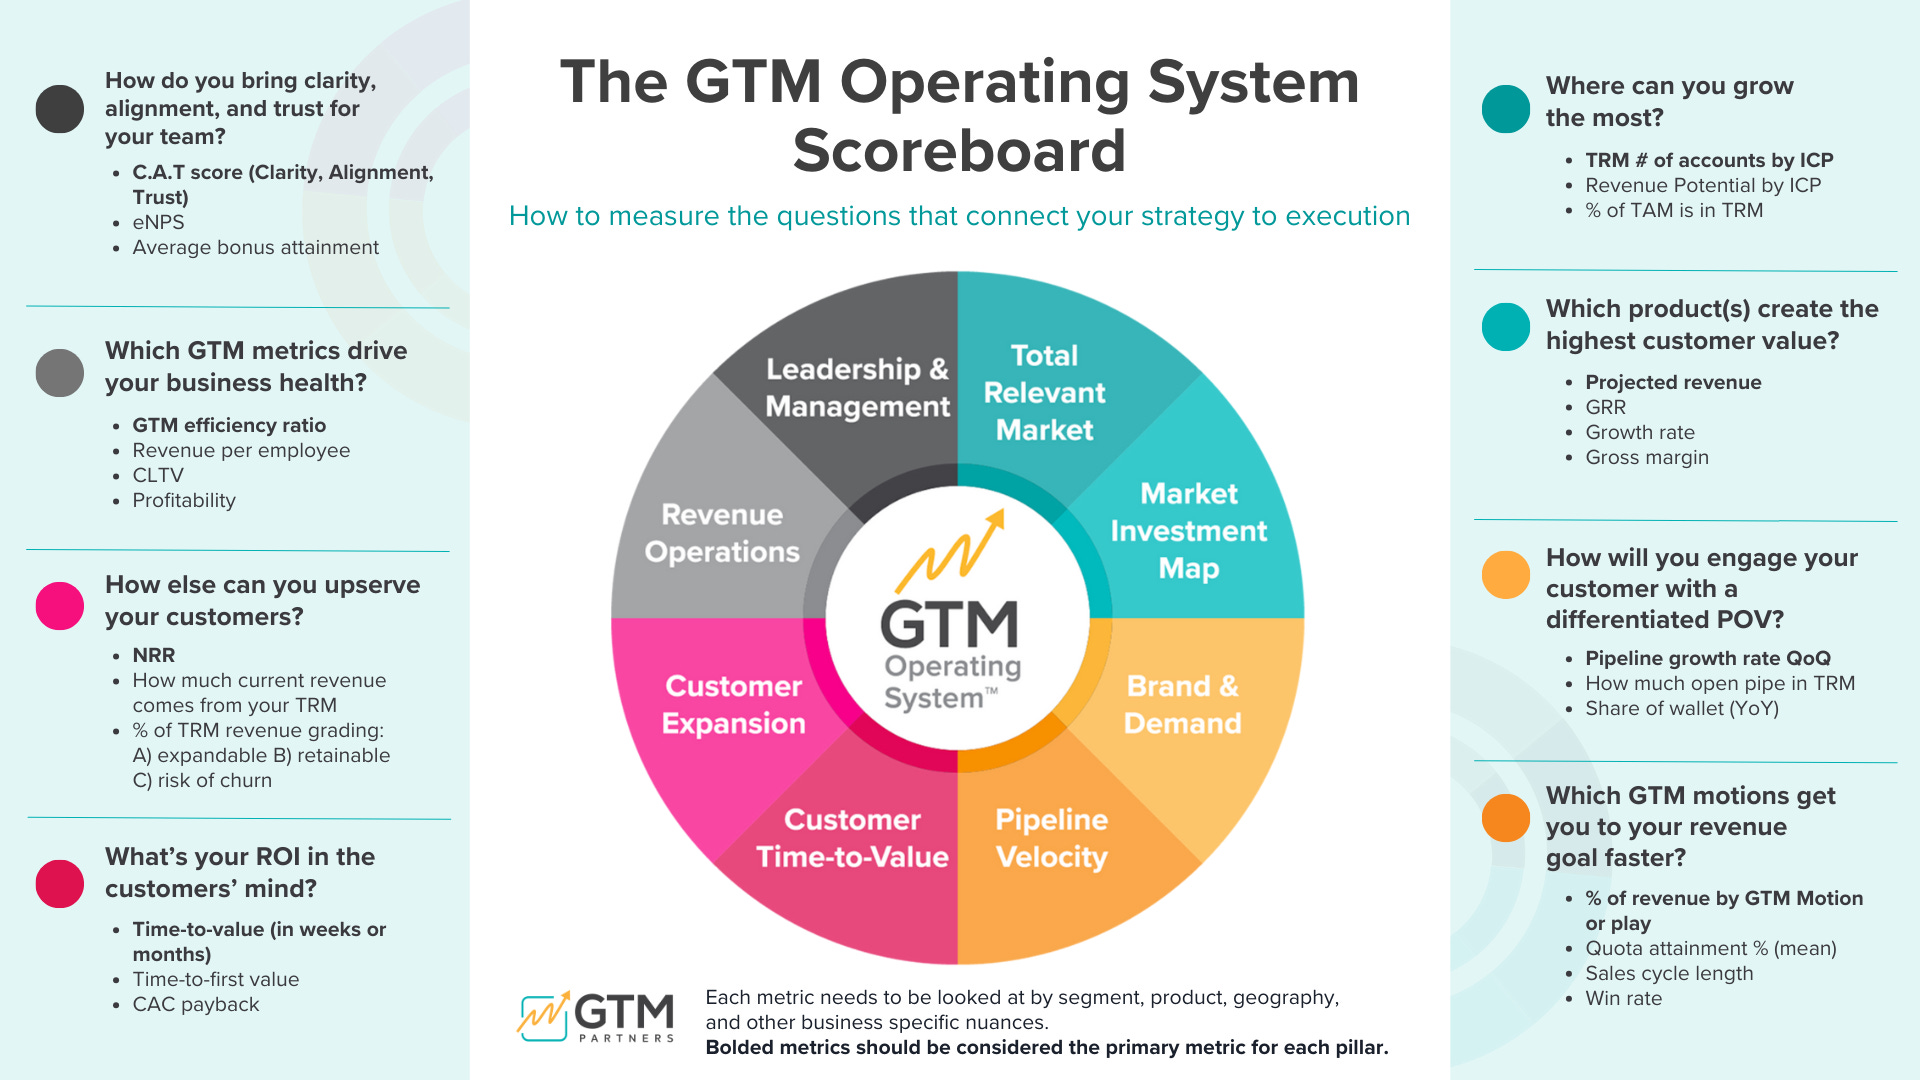
The scoreboard below offers a fantastic visual framework for thinking about GTM metrics specifically.
Operational Outcomes
These measure internal efficiency and effectiveness, tying directly to your delivery process and technology transformation.
- Deployment Frequency: How often can you release code to production? For a microservices architecture, this should increase dramatically.
- Lead Time for Changes: How long does it take to get a change from commit to production? This should decrease.
- Process Cycle Efficiency: The ratio of value-adding time to total process time.
- Team Autonomy / Decision-Making Speed: Harder to quantify, but can be measured via surveys or by tracking dependencies between teams.
Measuring Behavior Change
Finally, remember that KPIs are the result. The cause is a change in behavior. As an L&D expert, you know that measuring the adoption of new behaviors is a powerful leading indicator.
Creating Sustainable Organizational Culture Change in 80 Days | Arthur Carmazzi | TEDxMaitighar
In this short clip from his TEDx talk, Arthur Carmazzi makes a critical point about what we should be measuring to drive sustainable change.
Watch this brief segment from 21:44 to 23:06. Focus on the distinction between measuring the behaviors and measuring the KPIs that result from them.
This is a vital concept. For example, instead of only measuring Deployment Frequency (the KPI), you could also measure behaviors that lead to it, such as number of teams that have adopted automated testing practices or percentage of developers contributing to shared component libraries.
4. Application Exercise: Defining Success for Project Phoenix
Now, let's put this into practice. Your task is to define one primary success outcome for each of the four main pillars of Project Phoenix. For each outcome, specify the metric, the reason for choosing it, and whether it's a leading or lagging indicator.
Your Task (15 minutes):
Complete the table below. Be specific and link your rationale back to the goals of the transformation.
Project Phoenix: Primary Success Outcomes
| Transformation Pillar | Key Outcome / Metric | Rationale (Why does this metric define success for this pillar?) | Indicator Type (Leading/Lagging) |
|---|---|---|---|
| Organizational Transformation | |||
| Product/Tech Transformation | |||
| Delivery Process Transformation | |||
| Go-to-Market (GTM) Transformation |
Click here to see a sample answer after you have completed your own.
Project Phoenix: Primary Success Outcomes (Sample Answer)
| Transformation Pillar | Key Outcome / Metric | Rationale (Why does this metric define success for this pillar?) | Indicator Type (Leading/Lagging) |
|---|---|---|---|
| Organizational Transformation | Team Health & Autonomy Score: A quarterly survey metric combining questions on decision-making authority, cross-team collaboration, and clarity of mission. | This measures if the new "stream-aligned" team structure is actually empowering teams and reducing bureaucratic overhead, which is a core goal of the reorganization. It's a direct pulse on the cultural shift. | Leading |
| Product/Tech Transformation | Adoption Rate of New AI-Powered Module: Percentage of eligible customers who have activated and are regularly using the new AI features within 3 months of availability. | This directly measures whether the most innovative part of the tech transformation is delivering real value to customers. It validates the significant R&D investment in AI. | Lagging (for the feature), but Leading (for overall ROI) |
| Delivery Process Transformation | Lead Time for Changes: The median time it takes for a code commit to get into production. The goal is to reduce this from 6 weeks (monolith) to under 48 hours (microservices). | This is the ultimate measure of engineering agility. A low lead time indicates that our new architecture, tooling, and processes are working together to deliver value to customers faster and more safely. | Lagging |
| Go-to-Market (GTM) Transformation | Net Revenue Retention (NRR): The percentage of recurring revenue retained from existing customers, including expansion, downgrades, and churn. Goal: Increase NRR from 95% to 115%. | NRR is the single best metric to prove the success of a modular, value-based GTM strategy. An NRR over 100% means we are successfully upselling and cross-selling our new modular offerings, more than making up for any churn. | Lagging |
Conclusion
In this lesson, you have built a comprehensive framework for measuring the success of your transformation. You now have the tools to move beyond vague goals to a specific, multi-layered system of outcomes.
Key Takeaways:
- Clarity in Language: Differentiate between metrics (measures), KPIs (monitors of health), and Key Results (drivers of change).
- Three Levels of Measurement: A robust plan tracks change management activities, individual adoption and usage, and organizational business results.
- Balanced Scorecard: Success is defined across multiple dimensions—Financial, Customer-Centric, and Operational. Don't rely on a single metric.
- Leading and Lagging Indicators: Use leading indicators (like adoption and behavior change) to predict and influence your lagging indicators (like revenue and ROI).
Preview of the Next Lesson
You have now defined the vision, calculated the costs and benefits, assessed the risks, and defined what success looks like. You have all the core components of your strategic plan. The next step is to formalize this into a single, powerful document that secures leadership buy-in and aligns all key stakeholders.
In our next lesson, we will focus on how to Create a transformation charter that aligns leadership and key stakeholders. You will learn how to synthesize all the work we've done into a concise and compelling charter that will serve as the "North Star" for Project Phoenix.