Hello! Welcome to the final module of your Business Analysis course.
In our last lesson, we completed a deep dive into a data analysis case study. You saw the end-to-end technical process of using SQL to prepare data and Python to uncover business insights. That work is the foundation, but it's only half the battle. Your analysis has no impact until you can successfully communicate it to stakeholders and persuade them to act.
This lesson focuses on that crucial final step. Your learning outcome is to prepare and deliver a presentation of case study findings to a mock stakeholder panel. This is one of the most common formats for a final-round Business Analyst interview, and a core part of the day-to-day job. We will cover how to structure a compelling narrative, design effective visuals, and deliver your message with confidence.
1. It’s Not About You, It’s About Them: Know Your Audience
The single most common mistake in technical presentations is focusing on the analysis itself—the clever SQL query, the complex Python script. Stakeholders, however, don't care about your process; they care about what your findings mean for them and the business.
Before you create a single slide, you must analyze your audience. A typical panel for a case study presentation might include a department head, a product manager, and an engineering lead. Each has different priorities.
How to Present a Project Proposal to Stakeholders
To understand how to tailor your message, watch this segment from the video 'How to Present a Project Proposal to Stakeholders' by Adriana Girdler. It breaks down the different concerns of executives, sponsors, and team members, which is directly applicable to a case study panel.
Watch from 00:59 to 03:31. As you watch, think about how the interests of an 'executive' (big picture, ROI) differ from those of a 'sponsor' or team member (feasibility, workload).
A great tool to formalize this thinking is a Stakeholder Analysis Table. It helps you map out who you're talking to, what they care about, and how to best communicate with them.
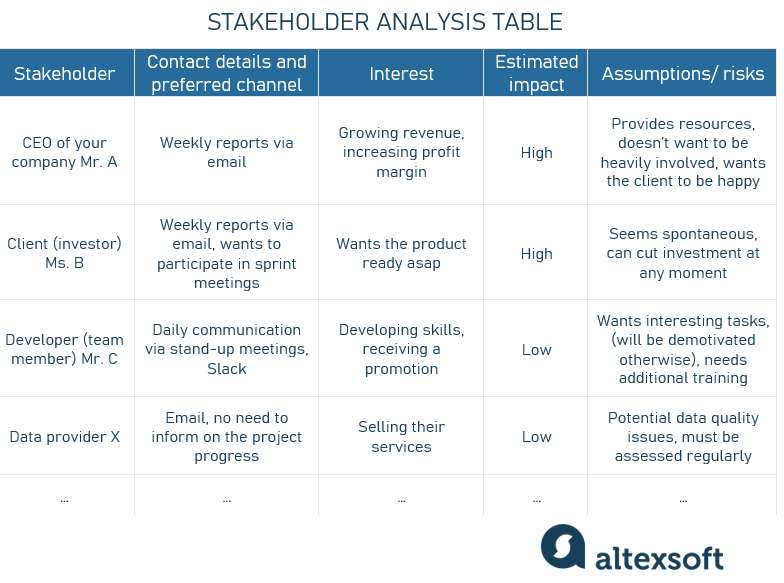
Test your understanding!
Imagine you're presenting findings for an AdTech campaign. Your panel includes the Head of Finance and the Client's Account Manager. What is the primary interest of each, and how would that change the key metric you emphasize for each of them?
Show answer
- Head of Finance: Their primary interest is profitability and cost efficiency. You would emphasize metrics like Cost Per Acquisition (CPA) or Return on Ad Spend (ROAS), focusing on how your recommendation improves the company's bottom line.
- Account Manager: Their primary interest is client satisfaction and retention. You would emphasize client-centric ROI and how your recommendation helps the client achieve their campaign goals more effectively, strengthening the relationship.
2. From Data to Decisions: Structuring Your Narrative
Once you know your audience, you need to craft a compelling story. Don't just walk through your charts. Guide your audience through a logical narrative that starts with a shared context and ends with a clear call to action.
A powerful framework for this is the STORY framework: Situation, Tension, Options, Recommendation, Yield.
Business Analyst Presentation Skills: Templates & Techniques
The article 'Business Analyst Presentation Skills' by Rafayel Hossain provides an excellent breakdown of this narrative structure. It will show you how to turn dry analysis into a persuasive story that drives decisions.
Please read the sections 'Why Most BA Presentations Fail Before You Even Start Speaking' and 'The STORY Framework That Turns Data Into Decisions'. Pay close attention to the example of Sarah's presentation; it's a perfect model of how to apply the framework.
Let's recap the STORY framework:
- S - Situation: Set the scene and remind everyone of the shared goal. (e.g., "We launched Campaign X to increase user sign-ups by 20%.")
- T - Tension: Introduce the core problem or opportunity your analysis uncovered. This is the "inciting incident" of your story. (e.g., "However, we're seeing that 40% of our ad budget is being spent on weekends, when conversion rates are near zero.")
- O - Options: Briefly present the potential paths forward, including the pros and cons of each. This shows you've thought through the problem thoroughly.
- R - Recommendation: State your recommendation clearly and back it up with the most critical data point.
- Y - Yield: Paint a picture of the positive outcome. What is the business impact (the "So what?") if they follow your recommendation? (e.g., "...leading to a projected 15% improvement in Return on Ad Spend.")
3. Designing for a Static World: Tableau for PowerPoint
In your role, you'll create beautiful, interactive Tableau dashboards. However, the reality in many companies is that these dashboards will be screenshotted and pasted into a PowerPoint deck for executive presentations. You must design for this reality.
Building Tableau Dashboards for the PowerPoint Download
The article 'Building Tableau Dashboards for the PowerPoint Download' offers crucial, practical advice for analysts who need their work to be effective both in Tableau and in a static presentation format.
Read the entire article. It's short but packed with essential tips. Focus on these key takeaways: Design for PowerPoint from Day One: Use the 16:9 aspect ratio. Accept that Functionality Disappears: Assume zero interactivity. If an insight requires a click, it won't be seen. Use Containers: They lock your layout in place and prevent elements from shifting during export.
The core principle is: Every critical insight must be visible on page load. Instead of one dashboard with many filters, you may need to create several pre-filtered dashboards (e.g., "Sales by Region," "Sales by Product Category") that can be exported as individual, clear slides.
4. Mock Case Study: The AdTech Campaign
Now, let's put this all together with a practical exercise. This scenario is tailored to your background in AdTech and is a very common type of BA case study.
The Scenario:
You are a Business Analyst at a Demand-Side Platform (DSP). Your company helps advertisers buy ad space to reach their target audience. A major client is running a campaign to drive professionals to their B2B service, targeting them at work via their office IP addresses.
Your analysis of the campaign data reveals a significant problem, as hinted at in the case study brief below.

Your Task:
You need to prepare a 5-slide presentation for a mock stakeholder panel consisting of:
- Head of Ad Operations: Cares about campaign efficiency, cost-per-acquisition (CPA).
- Senior Product Manager (for the DSP): Cares about platform features and identifying needs for the product roadmap.
- Client Account Manager: Cares about client satisfaction and campaign ROI.
Your assignment is to outline this 5-slide presentation using the STORY framework. For each of the five slides, provide:
- A strong, action-oriented headline.
- 2-3 bullet points summarizing the key message.
- A brief description of the visual/chart you would use.
You do not need to create the actual slides. Focus on the structure and narrative.
Click to see a sample outline to guide you.
-
Slide 1: Situation
- Headline: Campaign for "Client Z" Aims to Drive B2B Sign-ups with IP-Based Targeting
- Bullets:
- Objective: Generate 1,000 qualified leads in Q3.
- Strategy: Target professionals at their workplace using a curated list of corporate IP addresses.
- Budget: $100,000
- Visual: A simple graphic showing a user at a desk with the client's logo.
-
Slide 2: Tension
- Headline: Analysis Reveals 35% of Ad Spend is Wasted on Nights and Weekends
- Bullets:
- Our IP-only targeting runs 24/7, but conversions happen almost exclusively during business hours (M-F, 9am-6pm).
- This inefficiency is driving up our Cost Per Acquisition (CPA) by an estimated 40%.
- Visual: A bar chart showing ad spend (blue bars) vs. conversions (orange line) by hour of the day. The chart would clearly show spend continuing overnight while conversions drop to zero.
-
Slide 3: Options
- Headline: We Have Three Paths to Address the Inefficiency
- Bullets:
- Option 1 (Do Nothing): Continue the campaign as-is, accepting the high CPA and wasted spend.
- Option 2 (Pause Campaign): Halt the campaign to prevent further waste, but fail to meet the client's lead goal.
- Option 3 (Refine Targeting): Enhance our strategy with time-based rules to focus spend when users are active.
- Visual: Three simple icons or boxes representing the three options with brief pros/cons under each.
-
Slide 4: Recommendation
- Headline: Recommendation: Implement "Dayparting" to Limit Ads to Business Hours
- Bullets:
- We will configure the campaign to run only from Monday to Friday, 8 AM to 7 PM in the target time zones.
- This simple change requires no new technology and can be implemented by the Ad Ops team within 24 hours.
- Visual: A simple calendar/clock graphic showing the "ON" (green) and "OFF" (grey) times for the campaign.
-
Slide 5: Yield (The Payoff)
- Headline: Projected Impact: A 30% CPA Reduction and 1,500 Leads within Budget
- Bullets:
- Reallocating the saved 35% of budget to peak hours will increase conversion volume while staying within the $100k budget.
- Next Step: Approve this change and apply the learning to all future IP-targeted campaigns.
- Visual: Two large KPI cards. One shows "Current CPA: $140". The other shows "Projected CPA: $98".
5. Delivering with Confidence and Handling Questions
Your preparation isn't complete until you've practiced your delivery and anticipated the tough questions. An interview panel will purposefully challenge you to see how you handle pressure.
How to Present a Project Proposal to Stakeholders
This final video segment from Adriana Girdler provides excellent, actionable advice on how to practice, deliver your presentation effectively, and—most importantly—prepare for the Q&A session.
Please watch these two key sections: 'Practice and polish' (12:46 - 15:33): Focus on the tips for refining your wording and timing. 'Anticipate questions and own the answers' (19:11 - 22:05): This is critical. Pay attention to the common types of questions and the best way to respond if you don't know the answer.
The golden rule for Q&A: If you don't know the answer, never guess. A confident, "That's an excellent question. I don't have that specific data point right now, but I can analyze it and follow up with you by the end of the day," is far more impressive than a fumbled, incorrect answer. It shows honesty, ownership, and professionalism.
Conclusion
You've now covered the full lifecycle of a data case study, from technical analysis to persuasive communication. The ability to not only find the insight but to build a narrative around it and drive action is what elevates a Business Analyst to a strategic partner in the business.
Key Takeaways:
- Start with your Audience: Tailor your message, metrics, and language to what your stakeholders care about.
- Tell a STORY: Structure your presentation with the Situation, Tension, Options, Recommendation, and Yield to create a memorable and persuasive narrative.
- Design for Reality: Build your visualizations assuming they will end up in a static PowerPoint. Clarity trumps interactivity.
- Prepare for Pushback: Anticipate tough questions about your data and methodology, and have calm, confident responses ready.
Preview of the Next Lesson:
This lesson and the previous one equipped you to tackle a formal BA case study from scratch. In our next lesson, "Articulate past project management experience using business analysis terminology," we'll shift focus to your personal story. You'll learn how to reframe your extensive project management background into the language of business analysis, making your experience directly relevant and highly compelling to hiring managers.