Hello! Welcome to the first lesson of our new module, "Business Process and System Modeling."
In the previous module, we focused entirely on requirements—what a system must do. We learned how to elicit, document, prioritize, and manage them. Now, we're shifting our perspective from the what to the how. How does the business currently operate? How should it operate in the future? Answering these questions is a core function of a Business Analyst, and it starts with visualizing workflows.
Your background in project and operational management means you've certainly navigated complex workflows before. This lesson will give you a formal technique to map them out, making them easier to understand, analyze, and communicate to stakeholders.
Today's learning outcome is to create a high-level process map using flowchart notation. We will explore what a process map is, learn the basic symbols used to draw one, and walk through a step-by-step method for creating your first map.
What is a Process Map?
A process map is simply a visual diagram that shows the sequence of steps and decisions in a process. You might hear it called a flowchart, a workflow diagram, or a process flow diagram—they all refer to the same fundamental idea. Its power lies in its simplicity. A good map makes a complex process easy to understand at a glance, helping you and your stakeholders see the big picture and identify potential problems or areas for improvement.
Let's start with a short video that defines process maps and highlights their importance as a communication tool for Business Analysts.
How to Properly Draw a Process Map | Understanding Process Maps for Business Analysts
In this video, 'How to Properly Draw a Process Map' by Laura Brandenburg from Bridging the Gap, you'll get a clear introduction to what process maps are and why they are so valuable for getting early, impactful feedback from stakeholders.
Please watch the first 1 minute and 28 seconds of the video.
As the video explains, process maps are intuitively understood and are a strategic tool for discovering the true business problem before diving into detailed software requirements.
The Building Blocks: Basic Flowchart Symbols
To create a process map that anyone can read, we use a standard set of symbols. While there are many specialized symbols for technical diagrams, you only need to master a few to create clear and effective high-level process maps.
The article "How to Create a Process Map to Visualize Your Workflow" provides a great summary of the essentials.
How to Create a Process Map to Visualize Your Workflow
This section of the article from Honeybear.ai breaks down the four most common symbols you will use. Understanding these is the first step to building any flowchart.
Please read the subsection titled 'Understand the Basic Symbols'. It's short and will give you the core vocabulary for process mapping.
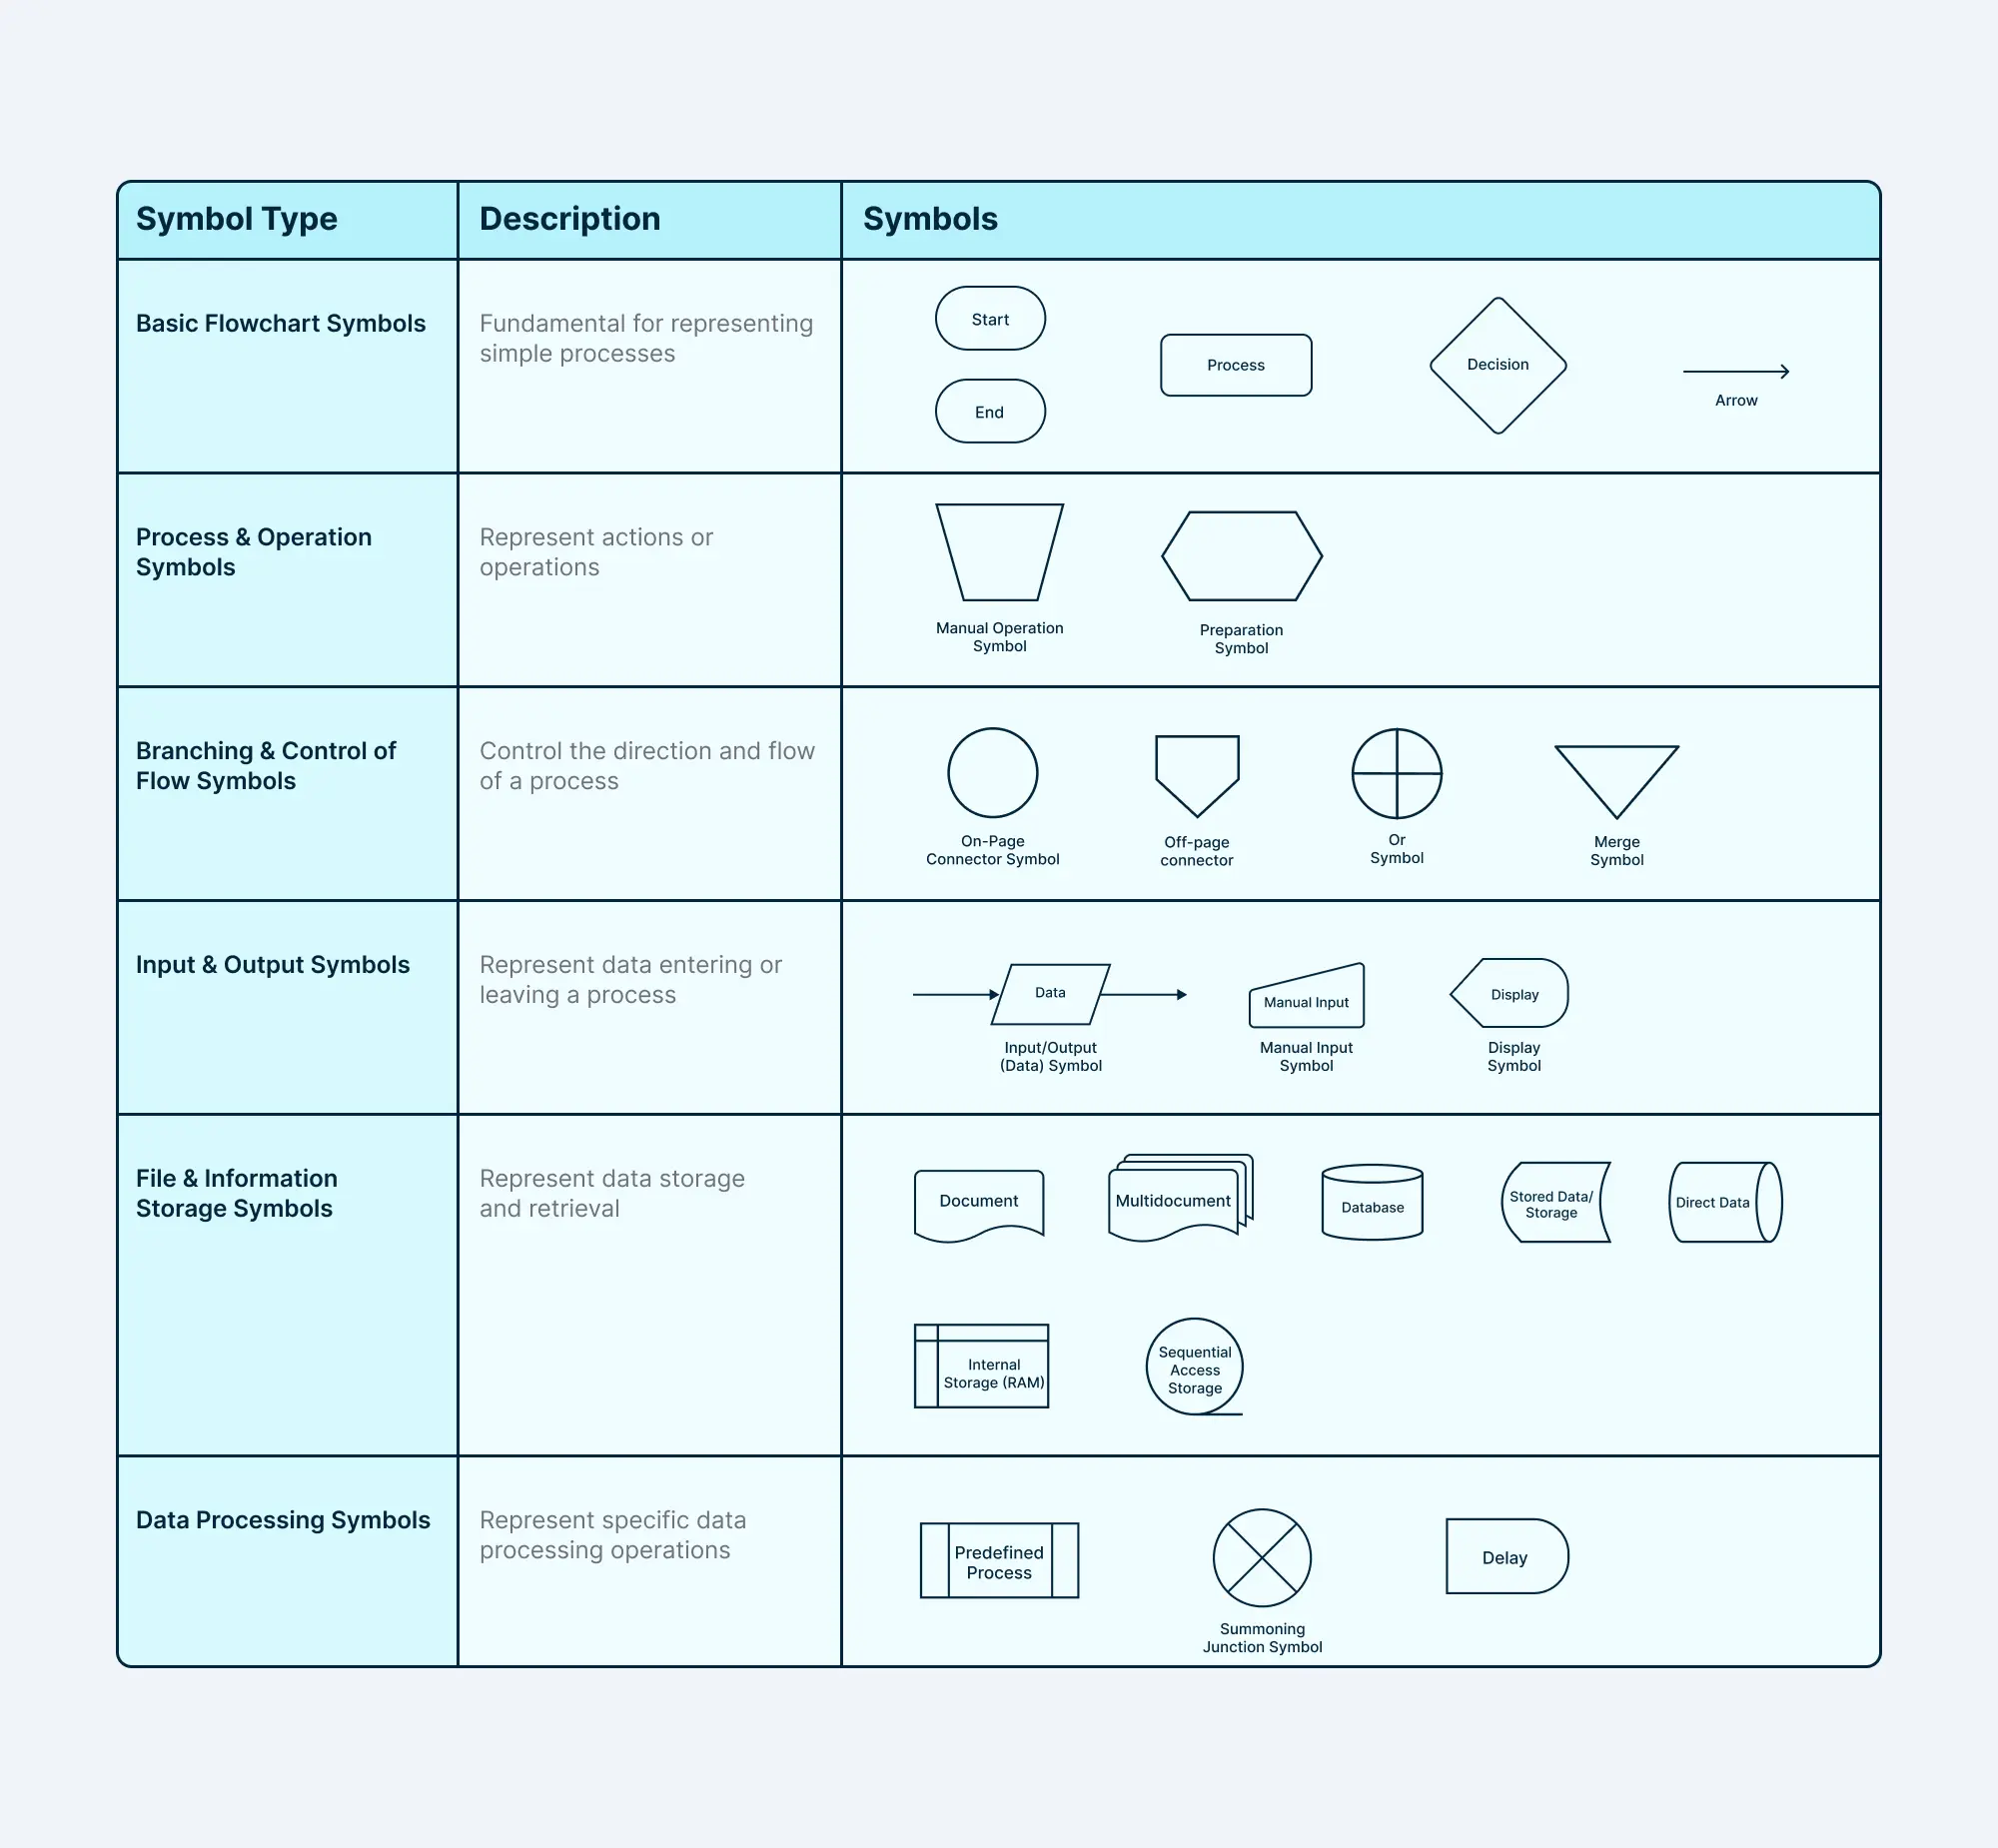
To summarize, these are your four fundamental building blocks:
- Oval (Terminator): Represents the start and end points of the process.
- Rectangle (Process): Represents a single task, action, or operation.
- Diamond (Decision): Represents a point where a decision must be made, which determines the next step. The paths branching off a diamond are typically labeled (e.g., 'Yes/No' or 'True/False').
- Arrow (Flow Line): Connects the symbols and shows the direction of the process flow.
Here is a visual reference that includes these basic symbols and a few others you might encounter.
How to Create a High-Level Process Map
Creating a process map is a structured activity. Rushing to draw boxes and arrows without preparation can lead to a confusing and inaccurate diagram. A methodical approach ensures clarity and accuracy.
Here is a six-step process that combines research, drafting, and refinement:
1. Define the Process and Its Boundaries
Before you draw anything, get clarity.
- Give it a name: Start with a verb (e.g., "Onboard New Client," not "Client Process").
- Define the scope: What is the very first action that triggers the process? What is the final action that signifies it's complete? These are your start and end points.
2. Brainstorm the Activities
Talk to the people who actually perform the process. List all the tasks and decisions involved. At this stage, don't worry about the exact order; just capture everything. Your experience as a project manager, where you've had to understand team workflows, will be very helpful here.
3. Sequence the "Happy Path"
Organize the steps you've brainstormed into a chronological sequence. Start by mapping the "happy path"—the most common, ideal route the process takes when everything goes as planned, with no errors or exceptions.
4. Draw the Flowchart using Standard Symbols
Now it's time to visualize. Use the symbols we just learned to draw the happy path.
- Start with an Oval for the beginning.
- Use Rectangles for each action.
- Connect them with Arrows.
- End with an Oval.
5. Add Decisions and Exceptions
Real-world processes are rarely a straight line. Now, go back and add the exceptions and alternative paths.
- Where do decisions need to be made? Insert a Diamond.
- Draw the branching paths that result from the decision. For example, if a manager's approval is needed, the decision diamond would be "Is it approved?". One path for "Yes" and another for "No".
6. Review and Refine
Share your draft with the stakeholders you interviewed in Step 2. Ask them: "Does this reflect how the work is actually done?" Use their feedback to correct any inaccuracies, fill in missing steps, and ensure the map is a true representation of reality.
Let's watch a short video that walks through some of these key steps, especially the preparatory work that makes the drawing phase much easier.
How to Properly Draw a Process Map | Understanding Process Maps for Business Analysts
Let's return to the 'How to Properly Draw a Process Map' video. This segment covers the crucial first steps of naming and scoping your process, demonstrates what a finished map can look like, and touches on identifying exceptions.
Please watch from 01:28 to 07:58. Pay attention to how defining the start and end points creates a 'container' for your process and how decision diamonds are used to represent exceptions.
An Example from the AdTech World
Theory is great, but seeing a real-world example makes it stick. Given your background in AdTech, let's analyze a high-level process map for a direct ad server integration.
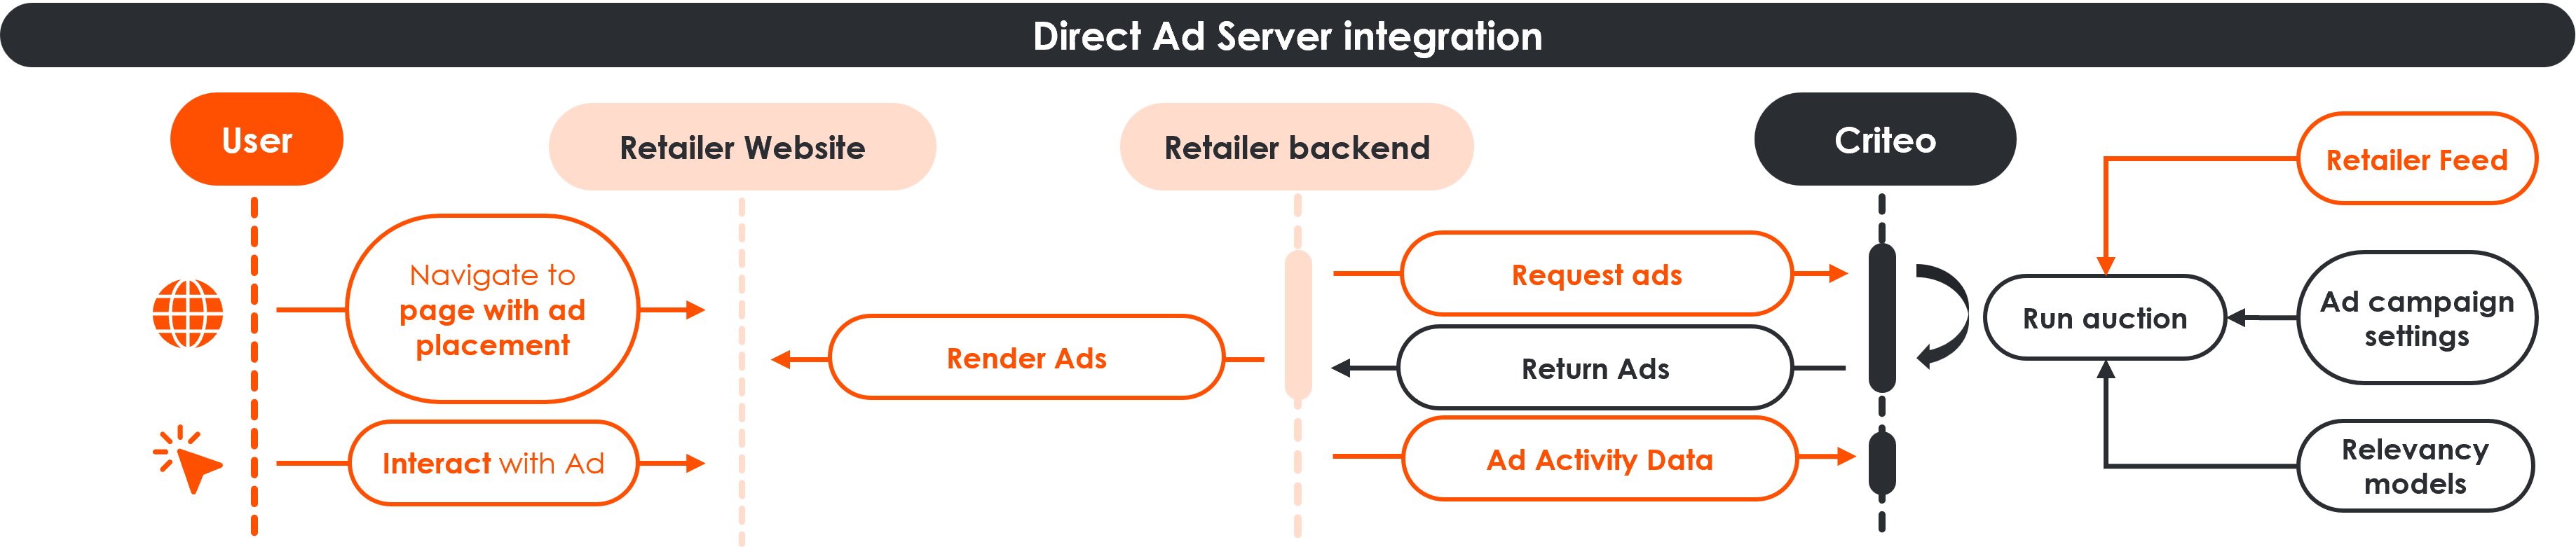
Let's break down what this map shows:
- Actors/Systems: The process involves the
User, theRetailer Websiteand itsBackend, and theCriteo Ad Server. These are similar to the swimlanes mentioned in the video. - Start Point: The process begins when the
User navigates to a web pagethat has an ad placement. - Process Steps (Rectangles): We see clear actions like
Retailer page requests adsandCriteo renders ad. - Sub-Process: Notice the
Run Auctionstep. Inside the Criteo box, this high-level step is broken down into more detail (considering feeds, settings, and models). This is a great example of keeping a main map clean while acknowledging deeper complexity. - End Point: The process concludes when the
Ad is displayedand the user potentially interacts with it (User clicks/views ad).
This map effectively communicates a complex technical process to different stakeholders (e.g., a new account manager or a partner developer) without getting lost in code-level details.
Test your understanding!
Think about a common process from your work or interest in content creation: "Publishing a new blog post."
Before drawing anything, outline the key components for a process map based on the steps we've discussed:
- What is a clear start point and end point for this process?
- List at least four main activities (these would be rectangles on the map).
- Identify at least one key decision point (this would be a diamond).
Show answer
Of course, your answer might vary, but here is a sample outline:
-
Start Point: Idea for blog post is finalized.
End Point: Blog post is live and promoted on social media. -
Main Activities (Rectangles):
- Draft blog post content.
- Create or source relevant images/graphics.
- Upload content and images to the Content Management System (CMS).
- Schedule social media promotion.
-
Decision Point (Diamond):
- "Does the draft need revisions?"
- Yes: Send back to the writer for edits.
- No: Proceed to upload to the CMS.
- "Does the draft need revisions?"
This preparatory thinking is the most important part of process mapping!
Conclusion
Congratulations! You've just learned a foundational business analysis skill. Process mapping is the first step toward understanding, analyzing, and ultimately improving how a business operates. It’s a powerful tool for turning a complex series of tasks into a clear visual story that everyone can understand.
Key Takeaways:
- A process map (or flowchart) is a visual representation of a workflow, used to communicate, analyze, and improve processes.
- You can create clear, high-level maps using just four basic symbols: Oval (start/end), Rectangle (task), Diamond (decision), and Arrow (flow).
- Creating a good map is a structured process: Define scope -> Brainstorm activities -> Sequence the happy path -> Draw -> Add exceptions -> Review.
- The goal is clarity, not artistic perfection. Start simple and validate your map with the people who do the work.
Preview of the Next Lesson:
Today, we used basic flowchart notation, which is excellent for high-level communication. However, for more detailed and standardized process analysis, BAs often use a more rigorous set of symbols known as BPMN (Business Process Model and Notation).
In our next lesson, we will dive into BPMN, learning how to model processes using its core elements like tasks, events, and gateways. This will build directly on what you've learned today, giving you a more powerful and precise modeling language for your BA toolkit.