Hello! Welcome to the final lesson in our module on Business Process and System Modeling.
In our last lesson, we learned how to create a Context Diagram to define a system's boundaries by mapping the high-level data flowing into and out of it. We answered the question, "What data does the system exchange with the outside world?" Today, we're going to zoom in and look inside a system's processes to model how decisions are made.
This lesson will teach you how to model business rules using decision tables or decision trees. These tools are fundamental for a Business Analyst because they allow you to take complex, often ambiguous, business logic and translate it into a clear, complete, and verifiable format. This precision is vital for creating formal documentation and ensuring that developers build the system exactly as the business intends.
From Ambiguous Rules to Clear Logic
Business processes are guided by business rules. These are the specific, operational policies or constraints that direct decision-making. For example:
- "Premium customers who spend over $500 get a 15% discount."
- "If an ad campaign's click-through rate drops below 0.1% for three consecutive days, send an alert to the account manager."
When rules are simple, you can write them down as text. But as the number of conditions and outcomes grows, text becomes a tangled mess of "if-then-else" statements, which is hard to understand and easy to get wrong.
How to Create Decision Trees for Business Rules Analysis
This article from 'Why Change' briefly explains the challenge of capturing complex business rules with simple text.
Read the first three paragraphs, starting from 'Business rules are a key ingredient...' and ending with '...decision tables and decision trees – are useful to master.' This will set the stage for why we need structured modeling techniques.
To solve this problem, we use two powerful techniques: Decision Tables and Decision Trees.
Decision Tables: Structuring Complex Logic
A decision table is a tabular method for organizing business rules in a way that ensures all possible combinations of conditions are considered. It's a fantastic tool for ensuring completeness and communicating complex logic to both business stakeholders and technical teams.
Anatomy of a Decision Table
A decision table is typically divided into four quadrants:
- Conditions: The factors or criteria that are evaluated (e.g., "Customer Type," "Purchase Amount").
- Actions: The possible outcomes or operations that can be taken (e.g., "Apply 10% Discount," "Offer Free Shipping").
- Condition Entries (Rules): The different combinations of condition values (e.g., Customer Type = 'New', Purchase Amount > $100). Each column represents a unique rule.
- Action Entries: An indicator (like an 'X') that marks which action to take for a given rule.
Let's look at a concrete example.

Why and How to Use Decision Tables
Decision tables are more than just an organizational tool. They bring significant benefits to a project, which is important to articulate during interviews or stakeholder discussions.
Understanding Decision Tables: A Complete Guide for ...
To understand the core benefits and structure of decision tables, please read the following sections from 'Understanding Decision Tables: A Complete Guide for Beginners' by Camunda.
Read the sections titled 'Why use decision tables?', 'How decision tables work', and 'How to create a decision table'. Focus on the four key benefits (Clarity, Complexity, Error reduction, Maintainability) and the step-by-step process for building a table.
The key steps to creating a decision table are:
- Identify all business rules related to a specific decision.
- Deconstruct the rules into a set of unique conditions and actions.
- Create the table structure with conditions on top and actions on the bottom.
- Populate the table by creating a column for each unique and relevant combination of conditions (a rule).
- Mark the corresponding action(s) for each rule.
The following video provides a detailed walkthrough of this process, starting from a set of written business rules.
decision table explained with example
This video by Karan Jetli Live provides an excellent practical demonstration of building a decision table for a library system. It's a great example of turning business policies into a structured model.
Watch from 02:54 to 18:36. Pay close attention to how the presenter first extracts the 'conditions' and 'actions' from the written library rules. Then, observe how he builds the table, carefully considering only the relevant combinations. This is a crucial point for keeping your tables manageable.
Test your understanding!
Let's apply this to your AdTech background. Imagine an ad platform has the following rules for publisher payouts:
- Publishers on the "Premium" tier are paid weekly, regardless of their balance.
- Publishers on the "Standard" tier are paid weekly if their balance is over $100.
- Publishers on the "Standard" tier with a balance of $100 or less are paid monthly.
Your task:
- Identify the Conditions.
- Identify the Actions.
- Sketch out the columns (Rules) for a decision table that models this logic.
Show answer
-
Conditions:
- Publisher Tier ('Premium' or 'Standard')
- Account Balance ('> $100' or '<= $100')
-
Actions:
- Pay Weekly
- Pay Monthly
-
Decision Table Rules:
| Conditions / Actions | Rule 1 | Rule 2 | Rule 3 |
|---|---|---|---|
| Conditions | |||
| Publisher Tier | Premium | Standard | Standard |
| Account Balance | - | > $100 | <= $100 |
| Actions | |||
| Pay Weekly | X | X | |
| Pay Monthly | X |
(Note the '-' for Account Balance in Rule 1, as it's irrelevant for Premium publishers based on the rules.)
Decision Trees: Visualizing Decision Paths
A decision tree is another way to model business rules, but it uses a graphical, tree-like structure. It's often preferred when the number of outcomes for each condition is small and when you want to create a model that is very easy for stakeholders to follow visually.
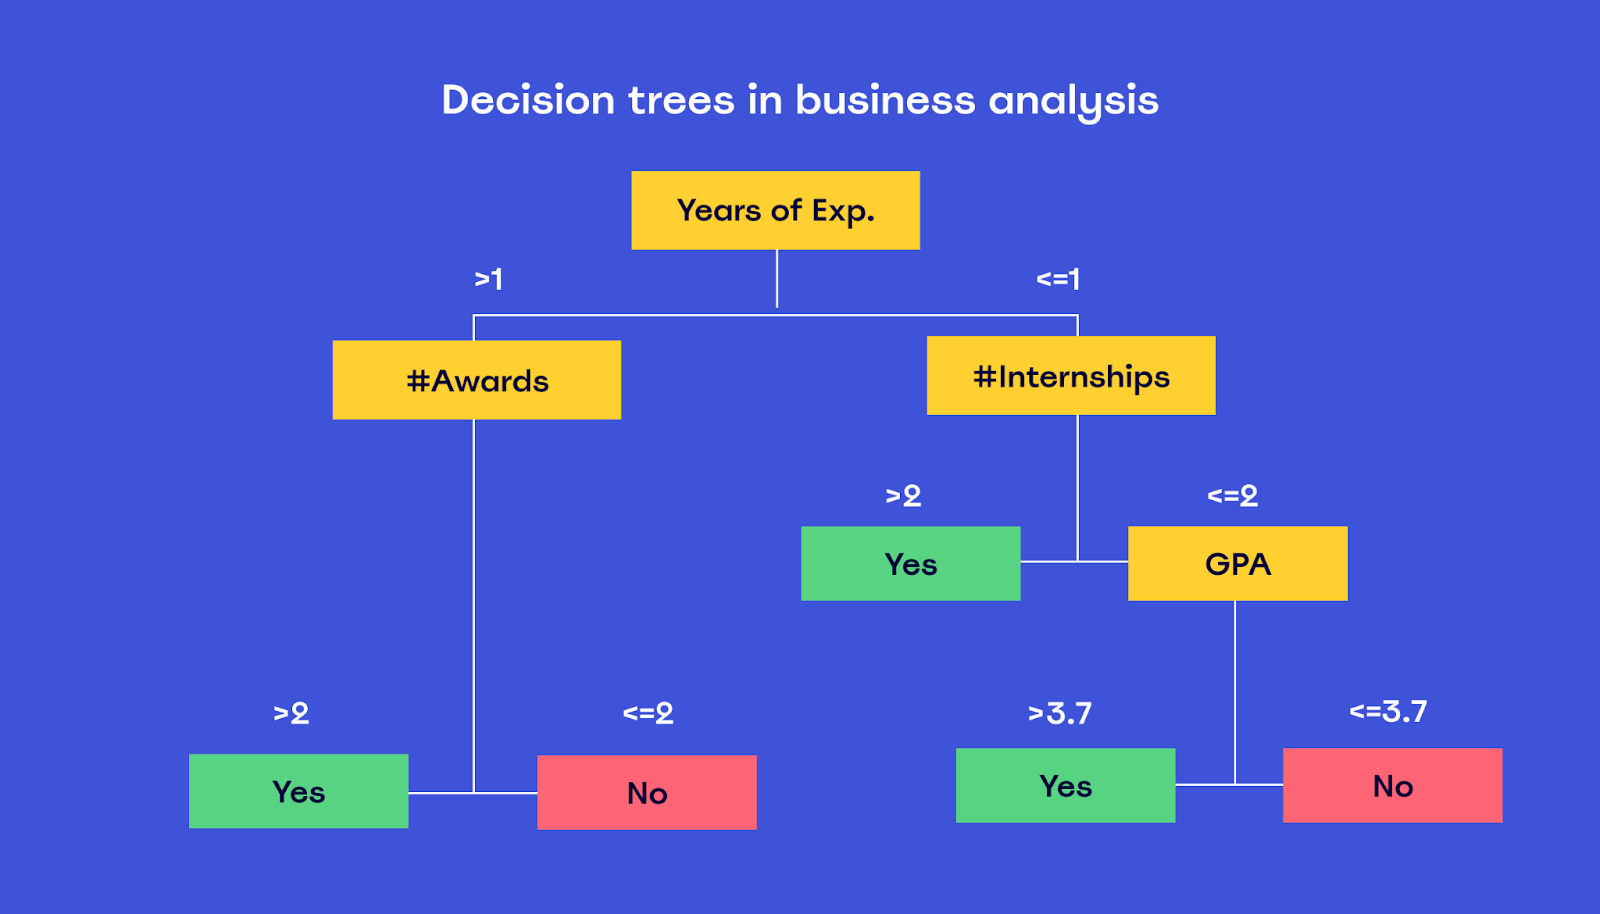
Anatomy of a Decision Tree
- Root Node: The starting point of the tree, representing the first condition to be evaluated.
- Branches: The lines connecting nodes, representing the possible outcomes or values of a condition (e.g., 'Yes'/'No' or 'High'/'Low').
- Internal Nodes: Subsequent conditions that need to be evaluated along a path.
- Leaf Nodes: The endpoints of the tree, representing the final actions or decisions.
Here is a simple example for a hiring decision.
Decision Trees vs. Decision Tables
Decision tables and trees can represent the same information. The choice between them often comes down to the nature of the problem and your audience.
Decision Trees & Decision Tables
This short clip from Eddie Woo quickly demonstrates how the same logic (from his restaurant example) can be shown as both a table and a tree.
Watch from 05:46 to 07:49. Notice how the branches of the tree correspond to the columns in the table he made earlier. This helps visualize that they are two different views of the same set of rules.
For a more detailed look at creating decision trees and the best practices involved, let's turn to another resource.
How to Create Decision Trees for Business Rules Analysis
The article from 'Why Change' we looked at earlier also provides excellent guidance specifically for decision trees.
Read the sections under the headings 'A decision tree is preferred...' and the best practice bullet points that follow. Focus on when to choose a tree over a table and the key rules for constructing a clear and correct tree.
Key best practices for decision trees include:
- Start with the most general condition at the root.
- Ensure the branches from any node are mutually exclusive and cover all possibilities.
- Keep labels concise and clear.
Test your understanding!
Let's use the same AdTech publisher payout rules from before:
- Premium publishers are paid weekly.
- Standard publishers with a balance > $100 are paid weekly.
- Standard publishers with a balance <= $100 are paid monthly.
Sketch a decision tree that models this logic. Start with "Publisher Tier" as the root node.
Show answer
Your decision tree should look something like this:
                      ┌─> [Pay Weekly]
(Publisher Tier?) ─┬─ (Premium)
                    |
                    │             ┌─> (> $100) ─> [Pay Weekly]
                    └─ (Standard) ─┤ (Account Balance?)
                                  │
                                  └─> (<= $100) ─> [Pay Monthly]
Conclusion
In this lesson, you've learned how to model complex business logic using two essential techniques: decision tables and decision trees. These tools help you move from ambiguous textual rules to precise, complete, and verifiable models.
Key Takeaways:
- Decision Tables excel at organizing complex rules with many conditions. They provide a structured, grid-based format that ensures no scenario is missed.
- Decision Trees are excellent for visualizing decision pathways in a flowchart-like manner, making them very effective for validation with non-technical stakeholders.
- Both techniques are critical for a Business Analyst to create clear requirements, reduce development errors, and ensure the final system behaves as the business expects.
Preview of the Next Lesson:
This lesson marks the end of our module on process and system modeling. You now have a powerful toolkit for analyzing and documenting what a system should do and how it should behave.
In the next module, we will pivot to a critical technical skill for any modern Business Analyst: data interrogation using SQL. Our first lesson will introduce the foundational SELECT statement, teaching you how to write your first queries to retrieve and filter data directly from a database. This is a crucial first step toward performing independent data analysis and providing data-driven insights.