Hello! Welcome to the first lesson in our module on "Applications in Data Analysis".
In our last module, we delved deep into the Singular Value Decomposition (SVD) and saw how it provided a powerful and robust way to solve least squares problems using the pseudoinverse. We saw that SVD reveals the fundamental structure of a matrix. Today, we'll explore another powerful technique that heavily relies on the concepts we've learned: Principal Component Analysis (PCA).
PCA is one of the most widely used techniques in data science and machine learning for dimensionality reduction, feature extraction, and data visualization. Today, our goal is to build a strong conceptual understanding of what PCA does. We will focus on answering the question: Why does PCA seek directions of maximum variance in the data? Understanding this is the key to grasping the entire method.
1. The Challenge: Making Sense of High-Dimensional Data
Imagine you are studying a complex system, like the performance of a deep learning model. You might track dozens or even hundreds of variables: learning rates, layer sizes, activation function types, training times, memory usage, different error metrics, etc. Trying to understand the relationships between all these variables by looking at them one by one is nearly impossible.
This is a common problem in data analysis. We often have datasets with many features (high dimensionality), where:
- Some features might be redundant (e.g., measuring temperature in both Celsius and Fahrenheit).
- The data is often noisy, making it hard to see the underlying patterns.
- The most important relationships might not align with our original measurement axes.
A great way to visualize this problem is with a simple physics example.
A Tutorial on Principal Component Analysis
Please read the introduction and the 'toy example' in the paper 'A Tutorial on Principal Component Analysis' by Jonathon Shlens. This will set the stage for why a technique like PCA is so necessary.
Read Sections I ('INTRODUCTION') and II ('MOTIVATION: A TOY EXAMPLE'). The example describes trying to understand a simple oscillating spring by using multiple cameras at arbitrary angles. This creates a messy, high-dimensional, and redundant dataset from a very simple, one-dimensional phenomenon.
As the example illustrates, our goal is to cut through the noise and redundancy to find the true, underlying simplicity in the data. PCA provides a systematic way to do this.
2. The Guiding Principle: Maximizing Variance
So, how can we find the "important" patterns in a cloud of data points? The core idea behind PCA is that the most important directions are those along which the data varies the most.
Imagine you're a whale shark swimming towards a swarm of krill. To eat as many as possible, you'd orient your wide mouth along the direction where the krill are most spread out. PCA does the same thing: it finds the axes along which the data is most spread out.
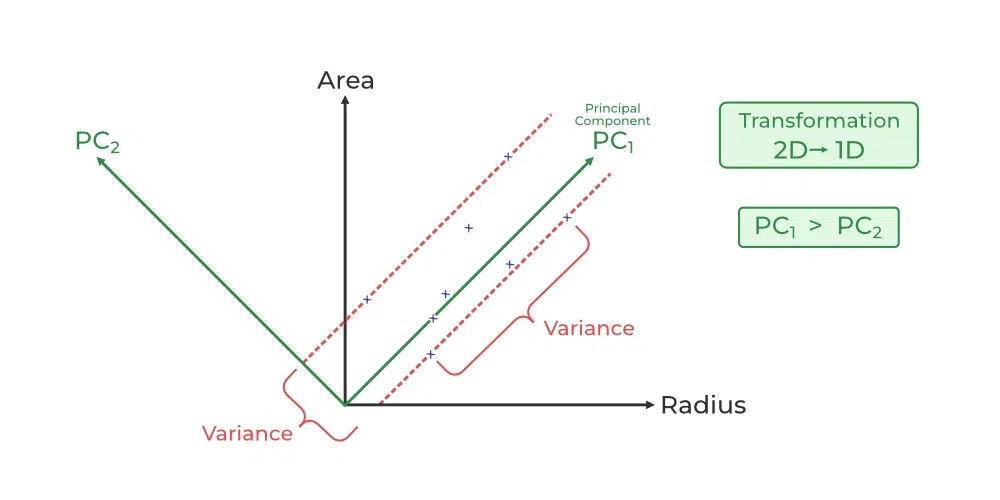
Why is this a good strategy? A direction with high variance is a direction that captures a lot of information about the data. A projection onto a high-variance axis preserves the spread of the data, and therefore the distances between points, much better than a projection onto a low-variance axis.
The following video provides an excellent and concise explanation of this exact point.
PCA 7: Why we maximize variance in PCA
This video, 'PCA 7: Why we maximize variance in PCA', directly addresses the central question of this lesson.
Watch the entire short video (0:00 - 2:59). Pay close attention to the visual example showing how projecting data onto the blue line (high variance) preserves the separation of the red points, while projecting onto the green line (low variance) makes them collide.
The key takeaway is that by prioritizing directions of high variance, we are essentially creating a new coordinate system that is optimally aligned with the structure of our data. The axes of this new system are called principal components.
3. Variance and Covariance: Quantifying Spread and Redundancy
Maximizing variance is about finding the most informative directions. But we also need to handle redundancy. To do this, we need to formalize these ideas with two statistical concepts: variance and covariance.
- Variance: Measures the spread of data along a single dimension. A high variance means the data is spread out. This is what we want to maximize.
- Covariance: Measures how two dimensions vary together. A high positive covariance means that when one variable increases, the other tends to increase as well. A high negative covariance means they have an inverse relationship. A covariance near zero means they are uncorrelated—there's no linear relationship between them. This is what we want to achieve for our new axes.
The following video gives a great visual intuition for covariance and introduces the covariance matrix, which neatly organizes all the variances and covariances for a dataset.
Visual Explanation of Principal Component Analysis, Covariance, SVD
Let's watch a segment from 'Visual Explanation of Principal Component Analysis, Covariance, SVD' to solidify our understanding of covariance and the covariance matrix.
Watch from 0:48 to 2:52. The first part gives a clever visual explanation of covariance using colored rectangles. The second part introduces the covariance matrix, which has variances on the diagonal and covariances on the off-diagonals.
The covariance matrix is the key. For a dataset with features, it's an symmetric matrix where:
- The diagonal entries, , are the variances of each feature.
- The off-diagonal entries, , are the covariances between feature and feature .
4. The Conceptual Framework of PCA
Now we can combine these ideas to define the conceptual goal of PCA. PCA aims to find a new basis (a new set of coordinate axes) to represent the data, such that in this new representation:
- Redundancy is eliminated. The new features are uncorrelated, meaning the covariance matrix of the transformed data is diagonal.
- Information is maximized. The new features (principal components) are ordered by variance, so the first few components capture most of the information in the data.
This is a powerful goal that turns a geometric intuition into a precise algebraic objective. Let's return to the Shlens tutorial to see this framework laid out.
A Tutorial on Principal Component Analysis
This section of the tutorial, 'VARIANCE AND THE GOAL', ties everything together. It explains how the goals of maximizing signal (variance) and minimizing redundancy (covariance) lead to the objective of diagonalizing the covariance matrix.
Read Section IV, 'VARIANCE AND THE GOAL', focusing on subsections A, B, C, and D. This is the core conceptual part of the lesson. It explains how PCA searches for a new orthonormal basis that diagonalizes the covariance matrix, effectively rotating the coordinate system to align with the directions of maximum variance.
To summarize the key points from the reading:
- We assume that directions with large variance contain interesting dynamics (signal), while directions with low variance are noise.
- We view high covariance between variables as redundancy.
- Therefore, the ideal representation of the data would be in a basis where the covariance matrix is diagonal. The diagonal entries would be the variances of our new basis vectors (the principal components), and the off-diagonal entries (the covariances) would be zero.
- PCA finds this new basis by, in essence, performing a rotation. The first principal component is the direction in space that maximizes variance. The second is the direction that maximizes variance subject to being orthogonal to the first, and so on.
Test your understanding!
Imagine you perform PCA on a 3D dataset. You get back a new covariance matrix for the transformed data (in the basis of the principal components) that looks like this:
What does this tell you about the original data and the principal components?
Show answer
- Uncorrelated Components: Since all off-diagonal elements are zero, the three principal components are completely uncorrelated with each other. PCA was successful in eliminating redundancy.
- Ordered Importance: The first principal component has a variance of 50, the second has a variance of 10, and the third has a variance of only 0.1. This tells you that most of the "action" or information in the data happens along the first PC. The data is highly spread out in that direction.
- Dimensionality Reduction: The variance of the third component is very small compared to the first two. This suggests that the original 3D data cloud is essentially a "pancake" that lies mostly on a 2D plane defined by the first two principal components. We could likely discard the third component without losing much information, effectively reducing the dimensionality from 3 to 2.
A Crucial Prerequisite: Data Centering
One important practical step is that before computing the covariance matrix and finding principal components, the data must be centered. This means that for each feature, we calculate its mean and subtract it from all data points. This ensures the data cloud is centered at the origin.
Why? Variance and covariance are defined as spread around the mean. If we don't center the data, the first principal component might just point from the origin to the center of the data, which tells us where the data is, but not the direction of its spread. Centering ensures we are only measuring the variance of the data itself.
Conclusion
In this lesson, we built the conceptual framework for Principal Component Analysis. We didn't get into the full computational details, but focused on the intuitive why.
Key Takeaways:
- PCA is a technique to find a more informative representation of high-dimensional data by creating a new set of coordinate axes, the principal components.
- The fundamental principle of PCA is to find directions of maximum variance, as these directions capture the most information and preserve the structure of the data.
- The goal is to find a new basis where the features are uncorrelated. Algebraically, this means finding a basis that diagonalizes the covariance matrix.
- The principal components are orthogonal axes, ordered by the amount of variance they explain. The first PC accounts for the most variance, the second for the next most, and so on.
Preview of the Next Lesson:
We've defined the what and the why. Next, we'll tackle the how. We will formalize the process and see a beautiful connection back to our previous topics: the principal components are nothing more than the eigenvectors of the covariance matrix, or equivalently, the right singular vectors () of the centered data matrix. This will link PCA directly to SVD and give us a concrete way to compute the components.