Hello! Welcome back to our module on AI performance metrics.
In the last lesson, we built a solid foundation by defining sensitivity and specificity. We learned that these metrics measure the inherent capabilities of a diagnostic test—its ability to correctly identify those with a condition (sensitivity) and those without it (specificity). We can think of them as describing the test's performance from a "lab" perspective, independent of any specific patient group.
However, in the clinic, you face a different question. When a patient is in your chair and you get a test result—perhaps from an AI flagging a potential lesion on a radiograph—you're not asking about the test's general properties. You're asking: "Given this specific result, what is the probability my patient actually has the disease?"
This is where today's lesson comes in. Our learning outcome is to: Define positive predictive value (PPV) and negative predictive value (NPV). These two metrics directly answer that clinical question and are among the most practical measures you will use to interpret AI-assisted findings.
From Test Properties to Patient Probabilities
While sensitivity and specificity look at all people with or without the disease, PPV and NPV shift the focus to all people who test positive or negative.
- Positive Predictive Value (PPV): If the test is positive, what is the probability that the patient actually has the disease?
- Negative Predictive Value (NPV): If the test is negative, what is the probability that the patient is actually disease-free?
To get a quick and clear introduction to how these values are calculated and interpreted, let's watch a short video.
Positive Predictive Value & Disease Prevalence
The video 'Positive Predictive Value & Disease Prevalence' from Medmastery provides a concise explanation of PPV and NPV, showing how they are calculated from the 2x2 table.
Watch the segment from 00:23 to 01:47. The video first calculates and explains PPV, then does the same for NPV, using a clear numerical example.
Calculating PPV and NPV
As the video demonstrated, we return to the familiar 2x2 contingency table that we used for sensitivity and specificity.
| Gold Standard: Disease Present | Gold Standard: Disease Absent | Row Total | |
|---|---|---|---|
| Test: Positive | True Positive (TP) | False Positive (FP) | TP + FP |
| Test: Negative | False Negative (FN) | True Negative (TN) | FN + TN |
Notice the key difference in calculation:
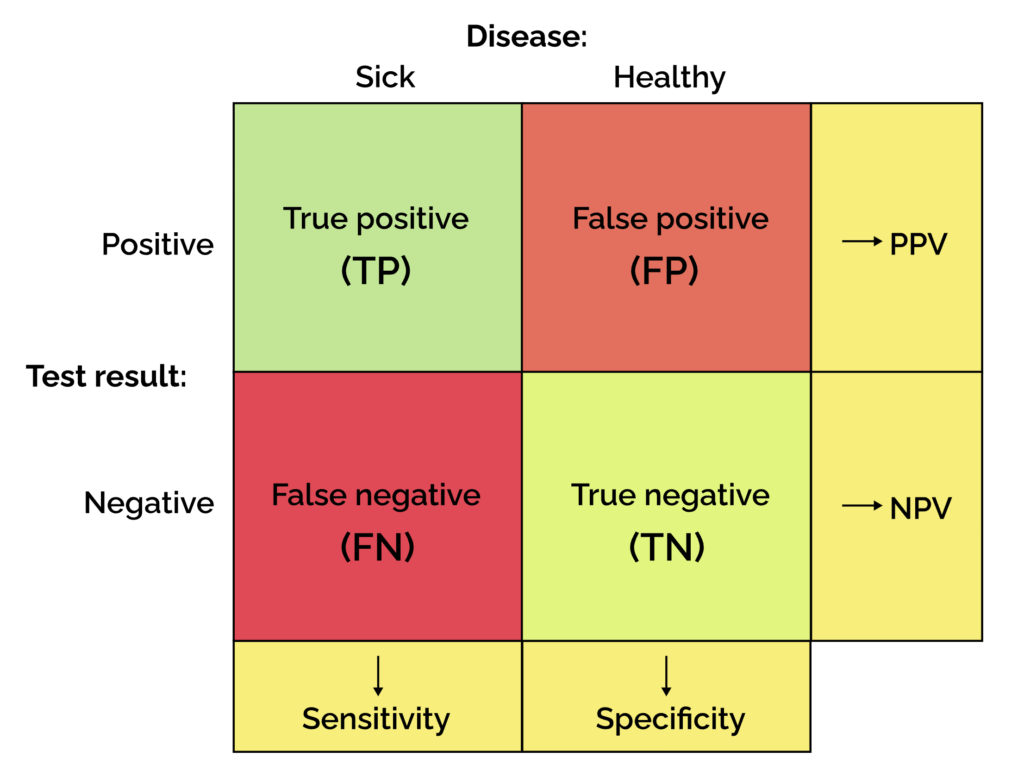
- Sensitivity and specificity are calculated using the columns (the "Gold Standard" groups).
- PPV and NPV are calculated using the rows (the "Test Result" groups).
Positive Predictive Value (PPV) is the proportion of all positive tests that are true positives.
Negative Predictive Value (NPV) is the proportion of all negative tests that are true negatives.
This image provides a great visual summary, showing how all four metrics relate to the 2x2 table. Sensitivity and Specificity are column-based, while PPV and NPV are row-based.
To solidify this, let's read the formal definitions from a clinical practice article published by the Canadian Dental Association.
[PDF] Part 2. Using Predictive Values and Receiver Operating ...
The paper 'A Closer Look at Diagnosis in Clinical Dental Practice: Part 2' explains why clinicians need predictive values and provides their formal definitions.
First, read the two short paragraphs under the heading 'Predictive Values' that define PPV and NPV. Then, look at 'Table 1' to see the formulas presented within the context of the contingency table.
The Critical Factor: Disease Prevalence
Here, we arrive at the most important—and perhaps least intuitive—concept about predictive values. Unlike sensitivity and specificity, which are stable characteristics of a test, PPV and NPV are heavily dependent on the prevalence of the disease in the population you are testing.
Prevalence is the proportion of individuals in a population who have a particular disease at a specific point in time.
- A test's PPV will be higher in a high-risk population (e.g., diagnosing periapical lesions in a symptomatic endodontic patient).
- A test's PPV will be lower in a low-risk screening population (e.g., screening for oral cancer in the general population).
This next video does an exceptional job of explaining why this happens using a memorable analogy.
Diagnoses, Predictive Values, and Whether You're Sick or Not: NPV and PPV
The video 'Diagnoses, Predictive Values, and Whether You're Sick or Not' from Healthcare Triage explains why PPV and NPV are not fixed properties of a test.
Watch the section from 02:12 to 04:55. Pay close attention to the 'fake-itis' coin-flip example. It demonstrates how changing the disease prevalence dramatically changes the PPV, even though the test's sensitivity and specificity (50% for a coin flip) remain the same.
The key takeaway is that you cannot take a PPV value from a study performed on a high-risk population and assume it will be the same when you use the test for general screening in your own practice. The context matters enormously.
PPV and NPV in a Dental AI Study
Now let's apply this to your goal of understanding AI in dentistry. How do these metrics appear in a real study evaluating a dental AI product?
We'll look at a paper assessing the AI software "Second Opinion®" for detecting various dental conditions.
Assessment of the Diagnostic Accuracy of Artificial Intelligence ...
The study 'Assessment of the Diagnostic Accuracy of Artificial Intelligence...' reports the PPV and NPV for an AI tool across several dental diagnostic tasks. This shows us exactly how these metrics are used in practice.
First, in the 'Statistical Analysis' section, read the short paragraphs defining PPV and NPV to see how they are described in a research context. Then, examine 'Table 2' in the Results section. Focus on the rows for 'Caries' and 'PA lesions' and locate their PPV and NPV values.
Let's pull out the results from Table 2 for two common conditions:
1. Caries Detection:
- PPV: 95.9%
- NPV: 74.5%
Interpretation:
- When this AI software flags a potential carious lesion (a positive result), there is a 95.9% probability that it is a true carious lesion. This gives you high confidence in a positive finding.
- When the software reports no caries (a negative result), there is a 74.5% probability that the tooth is truly sound. This means there's a ~25% chance a negative result is actually a false negative (a missed lesion).
2. Periapical (PA) Lesion Detection:
- PPV: 94.7%
- NPV: 95.4%
Interpretation:
- When the AI flags a PA lesion, there's a 94.7% chance it's correct.
- When the AI finds no PA lesion, there's a 95.4% chance it's correct.
These values give you a direct, probabilistic understanding of how much to trust a specific finding from the AI, which is far more practical in a clinical moment than knowing the test's overall sensitivity or specificity.
Conclusion
Today, we've shifted our perspective from the properties of the test to the perspective of the clinician interpreting a result for a single patient.
Key Takeaways:
- Positive Predictive Value (PPV) answers: "Given a positive test, what is the probability of disease?" It's calculated as .
- Negative Predictive Value (NPV) answers: "Given a negative test, what is the probability of no disease?" It's calculated as .
- The most critical difference from sensitivity and specificity is that PPV and NPV depend heavily on the prevalence of the disease in the tested population.
- PPV and NPV are crucial for translating a test result into a meaningful clinical probability for your patient.
You now have four essential tools for evaluating a diagnostic test: sensitivity, specificity, PPV, and NPV. In our next lesson, we'll address a very common but often problematic metric: overall accuracy. We will explore why overall accuracy can sometimes be a misleading metric, especially in situations with low disease prevalence—a concept you are now well-equipped to understand.