Hello! Welcome to the first lesson of our rapid-fire review course for the GATE DA exam.
Given your tight schedule and goal to get a high-level overview, we'll move quickly through the core concepts. This lesson focuses on a crucial topic in the Probability and Statistics syllabus: key probability distributions.
We will conduct a fast-paced review of four fundamental distributions: two discrete (Binomial and Poisson) and two continuous (Normal and Exponential). Since you have a basic background in probability, our focus will be less on derivation and more on recognizing what each distribution models, its key parameters, and when to use it. This will build a solid foundation for the subsequent lessons on statistical testing and machine learning.
Let's begin with a quick refresher on what a probability distribution is.
What is a Probability Distribution?
A probability distribution is a mathematical function that describes the likelihood of different possible outcomes for a random variable. To get a clear picture of the fundamentals, including the distinction between discrete and continuous variables, please watch the first part of this video.
Introduction to Probability Distributions
This video provides a concise overview of what a probability distribution is, its main characteristics like mean and variance, and the crucial difference between discrete and continuous distributions.
Please watch from the beginning until 06:38. Focus on the definitions of a distribution, mean, variance, and the distinction made between discrete (countable outcomes) and continuous (infinite outcomes) distributions.
To summarize the key points from the video:
- Discrete Distributions: Model random variables that can take on a finite or countable number of distinct values. Think of counting the number of heads in three coin flips (0, 1, 2, or 3). We use a Probability Mass Function (PMF) to describe the probability of each specific outcome.
- Continuous Distributions: Model random variables that can take any value within a given range. Think of measuring a person's height. We use a Probability Density Function (PDF), where the probability is represented by the area under the curve over an interval.
Now, let's dive into the specific distributions you need to know for the exam.
Discrete Distributions: Binomial and Poisson
You mentioned you've encountered these before, so we'll treat this as a quick refresher focused on their core applications and properties. The next segment of the video we just started explains the Bernoulli, Binomial, and Poisson distributions.
Introduction to Probability Distributions
This segment introduces three key discrete distributions. Pay close attention to how the Binomial distribution is built from a series of Bernoulli trials, and how the Poisson distribution relates to the frequency of events over an interval.
Please watch the sections on the Bernoulli, Binomial, and Poisson distributions from 08:59 to 12:42.
Key Characteristics
Here’s a breakdown of what you just reviewed:
-
Binomial Distribution
- What it models: The number of "successes" in a fixed number (
n) of independent trials, where each trial has only two possible outcomes (e.g., success/failure, yes/no, heads/tails). - Parameters:
- : The number of trials.
- : The probability of success on a single trial.
- Formula (PMF):
- Key Idea: Think of it as repeating a simple two-outcome experiment (a Bernoulli trial)
ntimes and counting the successes. - Example: Calculating the probability of getting exactly 7 heads in 10 coin flips.
- What it models: The number of "successes" in a fixed number (
-
Poisson Distribution
- What it models: The number of events occurring in a fixed interval of time or space, given a known average rate of occurrence.
- Parameter:
- (lambda): The average number of events per interval.
- Formula (PMF):
- Key Idea: Use this when you are counting occurrences of an event over a continuous interval. The events must be independent.
- Example: Modeling the number of emails you receive in an hour, given you receive an average of 5 emails per hour.
A common point of confusion is the relationship between the Poisson distribution and the Exponential distribution, which we'll cover next. This short video offers excellent intuition on how they, and the underlying Poisson process, are connected.
Understanding Exponential vs Poisson Distributions
This video clearly explains the difference between the Poisson and Exponential distributions by focusing on the core question each one answers.
Watch from the beginning to 05:02. Focus on the three characteristics of a Poisson process and the direct comparison between the two distributions.
The crucial takeaway is:
- Poisson asks: How many events happen in a fixed time interval? (Discrete)
- Exponential asks: How much time passes between events? (Continuous)
Continuous Distributions: Normal and Exponential
Now let's turn to continuous distributions. We'll use the same video resource to get a quick overview of the Normal and Exponential distributions.
Introduction to Probability Distributions
This final segment of the video introduces the concept of continuous distributions (PDF and CDF) and then covers two of the most important ones: the Normal and Exponential distributions.
Please watch from 12:42 to 18:14. Focus on the shape and properties of the Normal distribution's bell curve and the Exponential distribution's decay curve.
Key Characteristics
-
Normal Distribution (Gaussian Distribution)
- What it models: Many natural phenomena like height, blood pressure, measurement errors, etc. It is the most important distribution in statistics.
- Parameters:
- (mu): The mean, which is the center of the distribution.
- (sigma-squared): The variance, which determines the spread of the curve.
- Key Idea: It's a symmetric, bell-shaped curve. The 68-95-99.7 rule is a useful heuristic: about 68% of data falls within 1 standard deviation () of the mean, 95% within 2, and 99.7% within 3.
- Example: The distribution of IQ scores in a population, which has a mean of 100 and a standard deviation of 15.
-
Exponential Distribution
- What it models: The time between events in a Poisson process. It describes the waiting time for an event to occur.
- Parameter:
- (lambda): The rate parameter (the same as in the related Poisson distribution).
- Key Idea: The probability is highest at the beginning and decreases exponentially over time. It is "memoryless," meaning the probability of an event occurring in the future is independent of how much time has already passed.
- Example: Modeling the amount of time until a customer arrives at a store.
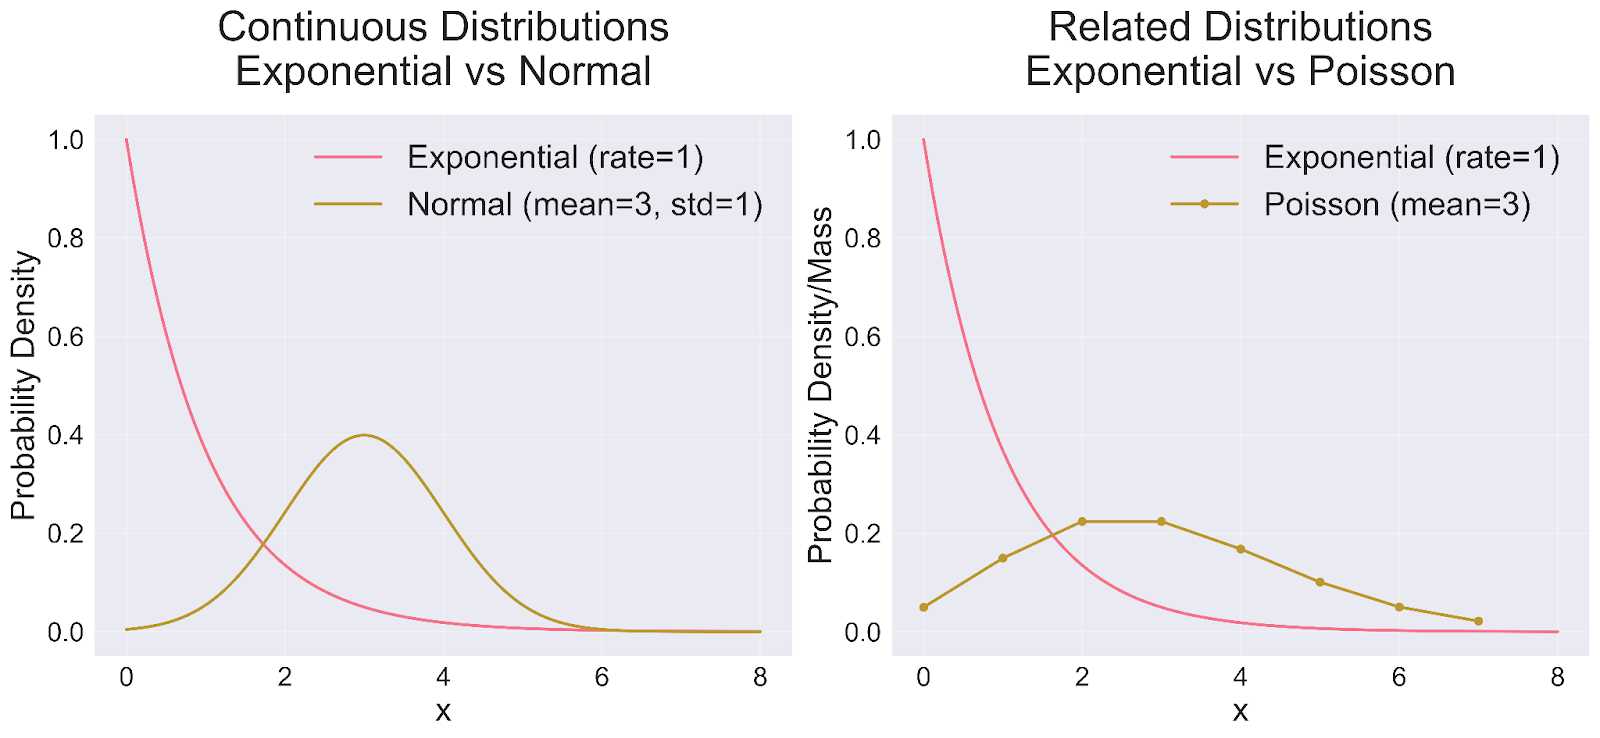
The image below provides a great visual comparison of the shapes of these distributions.
Summary and Quick Reference
To meet your goal of having quick refresher notes, the following PDF from GeeksforGeeks is an excellent resource. It provides all the key formulas and properties in a very condensed format, perfect for last-minute revision.
Probability & Statistics GATE DA - GeeksforGeeks
These notes are tailored for the GATE exam and provide a concise summary of the key properties of the distributions we've just discussed.
Review the sections on 'Discrete Distributions' (pages 5-6) and 'Continuous Distributions' (pages 6-7). Focus on the tables summarizing the Binomial, Poisson, Exponential, and Normal distributions. Note the formulas for Expectation (Mean) and Variance for each.
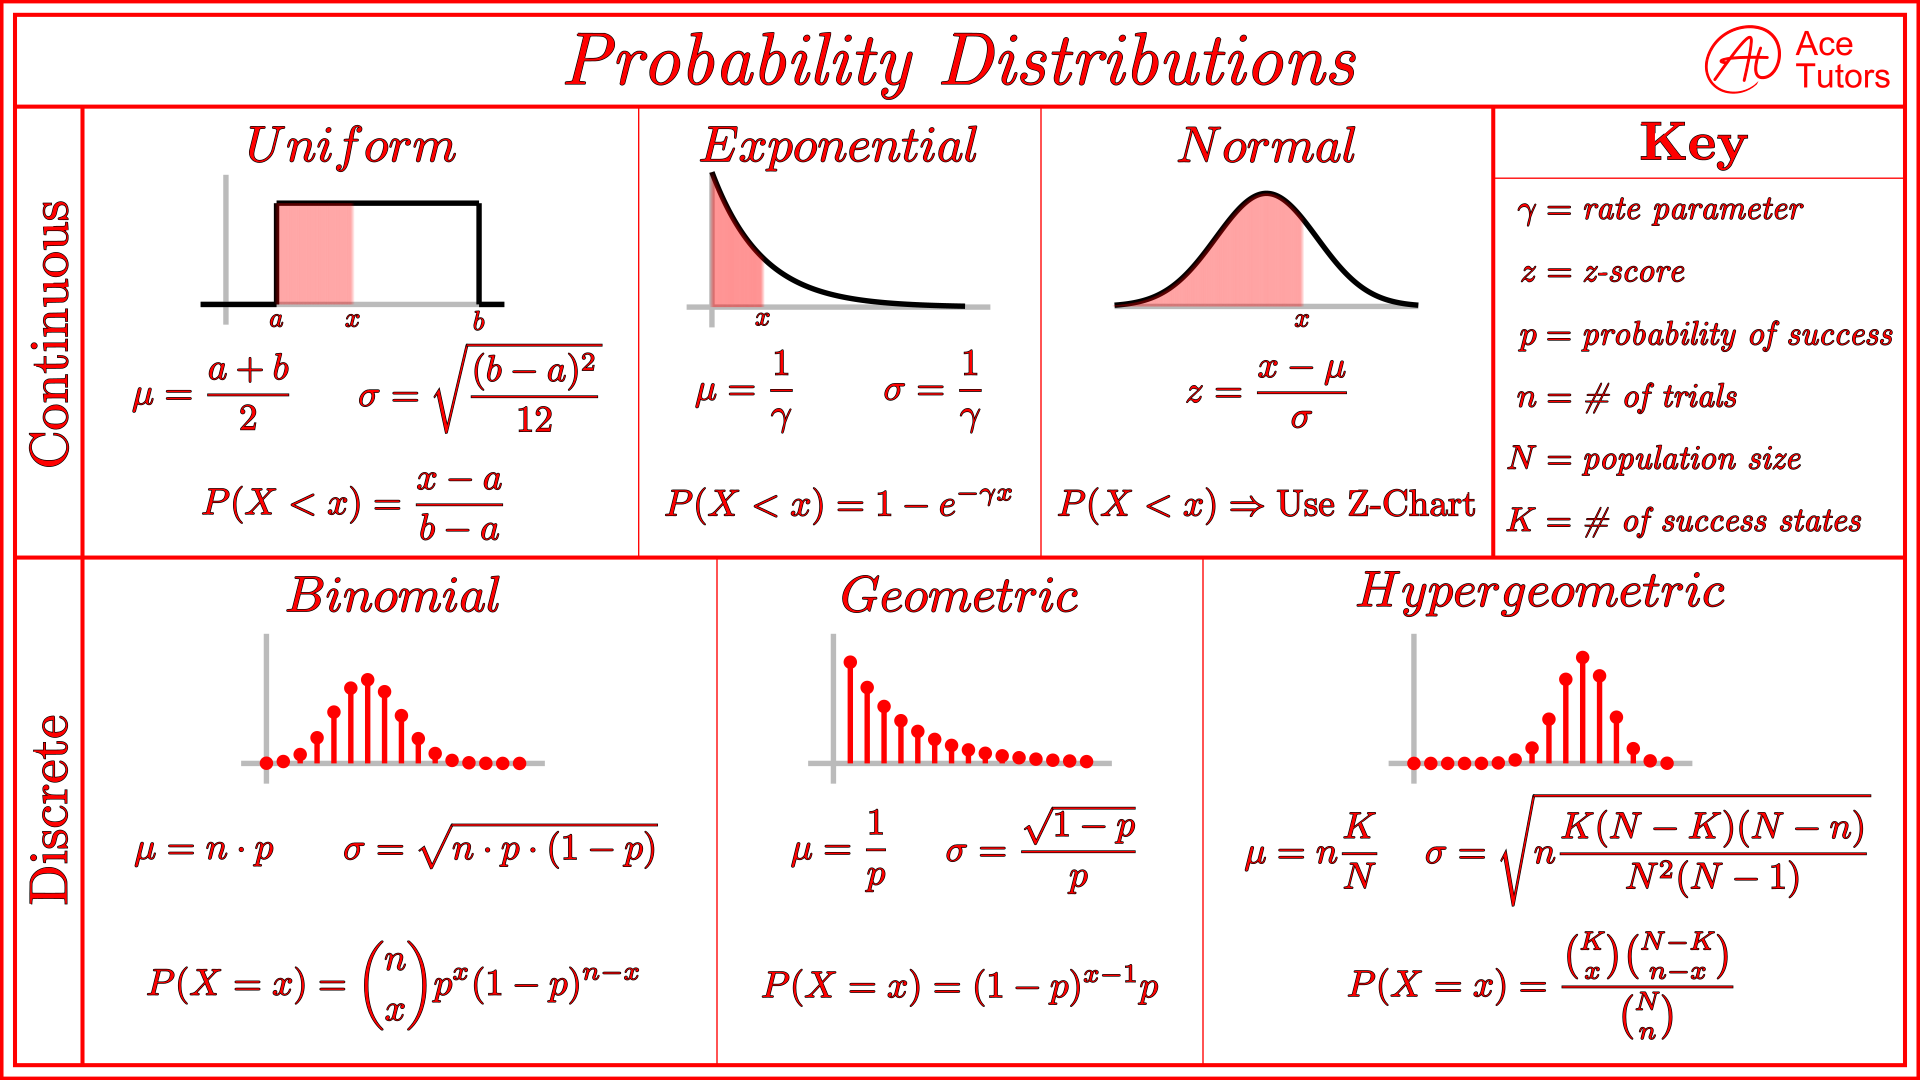
This image also serves as a fantastic one-page cheat sheet.
Conclusion
In this lesson, we completed a rapid review of four essential probability distributions.
Key Takeaways:
- Binomial Distribution: Counts successes in a fixed number of binary trials.
- Poisson Distribution: Counts event occurrences in a fixed interval.
- Exponential Distribution: Measures the time between events.
- Normal Distribution: A symmetric, bell-shaped curve that models a vast range of natural and social phenomena.
Understanding the "story" behind each distribution—what it models and why—is the most critical part for your exam.
Preview of the Next Lesson:
In our next lesson, we will continue our journey through statistics by introducing two more distributions that are crucial for hypothesis testing: the t-distribution and the Chi-squared distribution. Understanding these will pave the way for the statistical inference topics that follow.