Hello! Welcome back to our journey into building a path tracer.
In our last lesson, we established that path tracing is a Monte Carlo method for solving the rendering equation. We saw that by averaging the results of many random light paths, we can approximate the correct amount of light reaching each pixel. We also briefly touched on the idea that the "grain" or "noise" in your renders is a direct consequence of this statistical approach.
Today, we're going to dive deep into that concept. The goal of this lesson is to solidify your understanding of why path-traced images are noisy. We will formally identify this visual noise as variance in the Monte Carlo estimation. Understanding the nature of this noise is the critical first step before we can learn how to combat it effectively. In your work as a pipe TD, you've certainly seen noisy renders during look development; by the end of this lesson, you'll understand the mathematical and statistical reasons behind that familiar grain.
1. The Nature of a Random Estimate
At its heart, the Monte Carlo method uses randomness to estimate a deterministic value. Whether we're estimating the value of or the color of a pixel, the process is the same: take many random samples and average them. The "law of large numbers" guarantees that as we take more samples, our average will get closer to the true value. But what happens when we have only a few samples? The estimate fluctuates.
To build a strong intuition for this, let's watch a video that illustrates the core idea of Monte Carlo simulation.
The video 'Monte Carlo Simulation' from MarbleScience provides an excellent, non-technical introduction. It starts by estimating Pi and then connects the same ideas to light simulation.
Please watch from 01:05 to 06:09. Pay close attention to the graph shown around the 5-minute mark. Notice how the estimate for Pi fluctuates wildly at first and then stabilizes as more 'marbles' (samples) are dropped. This fluctuation is the key concept.
The key takeaway is that with a small number of samples, your estimate can be far from the true value simply due to bad luck. As you add more samples, the influence of any single "unlucky" sample is diminished, and the average converges.
2. From Fluctuation to Visual Noise
The fluctuation you saw in the Pi estimation is exactly what causes noise in your rendered images. Each pixel in your final image is an independent Monte Carlo estimation of the light arriving from the scene.
- The integral: The rendering equation's integral over the hemisphere.
- The true value: The real, correct color of that pixel.
- The samples: Each full path traced from the camera for that pixel.
- The estimate: The average color of all paths for that pixel.
When you use a low number of samples per pixel (SPP), the estimate for one pixel might be a bit too high (a lucky path hit a bright spot), while the estimate for its neighbor might be too low. This pixel-to-pixel difference in estimation error is what our eyes perceive as noise or grain.
Let's see this in action. The same video you just watched has a perfect demonstration.
Let's continue with the MarbleScience video, which now applies the same concept to rendering.
Watch from 06:09 to 08:58. The video explicitly shows how an image of a room becomes less noisy as more random light paths are simulated.
To reinforce this, here is a classic image from rendering literature that makes the trade-off between sample count, noise, and render time crystal clear.
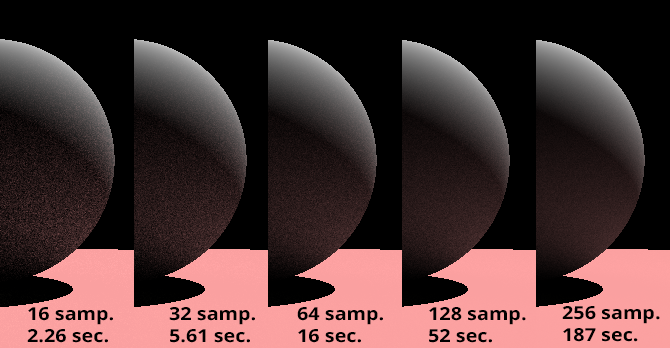
This relationship between sample count and noise is fundamental. To get a more formal handle on it, let's read a short explanation.
Global Illumination and Path Tracing
The article 'Global Illumination and Path Tracing' on Scratchapixel.com has a concise section explaining why path tracing is noisy.
Please read the section titled 'Monte Carlo Path Tracing is Slow and Noisy'. It uses a great analogy of a public opinion poll and explicitly states the rule of thumb for noise reduction.
The article highlights a crucial point: to reduce noise by half, you need four times as many samples. This isn't just an observation; it's a consequence of the mathematics behind the noise.
3. The Mathematics of Noise: Variance
The term for this statistical fluctuation is variance. Variance measures how spread out a set of random values are from their average. In path tracing, high variance means that individual path samples for a pixel can have wildly different color values, leading to a noisy final average. Low variance means the samples are all fairly similar, leading to a clean, stable average.
The previous lesson introduced this concept, but let's look at the math more closely. The standard deviation, , which is the square root of the variance, is what we perceive as noise. For a Monte Carlo estimator, it has a very specific form.
Demystifying multiple importance sampling
The blog post 'Demystifying multiple importance sampling' by Lisyarus provides a clear mathematical breakdown of Monte Carlo variance. While the whole post is great, we'll focus on one key section.
Read the section titled 'Some proofs'. Your CS and linear algebra background will be helpful here. The main goal is to understand the derivation that leads to the final formula for standard deviation, \sigma.
The most important equation from that section is:
Let's break this down:
- is the standard deviation—the "amount" of noise we see.
- is the number of samples (paths per pixel).
- is the function we are integrating (the terms inside the rendering equation integral).
- is the probability density function (PDF) of our sampling strategy.
This formula mathematically confirms what we've observed:
- The noise is proportional to . This is why you must quadruple the samples () to halve the noise ().
- The noise also depends on the variance of the function being sampled. The term is crucial. If this term is large, the image will be noisy even with many samples.
4. What Causes High Variance?
So, when is the variance term large? It happens when the values of fluctuate wildly. This occurs when our sampling strategy gives us a low probability ( is small) of hitting a sample with a very high contribution ( is large).
The classic example in rendering is a small, bright light source in an otherwise dark scene.
- Our current uniform sampling strategy sends rays in all directions equally. The probability of a ray randomly hitting the small light source is very low.
- Most rays will hit a dark wall, contributing almost no light ().
- Once in a while, a lucky ray will hit the light source, contributing a massive amount of energy ( is huge).
The average is pulled around by these rare, super-bright samples. This creates high variance, which manifests as "fireflies"—individual pixels that are unnaturally bright.
Conquering Noisy Images in Ray Tracing with Next Event Estimation
This video from NVIDIA developers demonstrates this exact problem, which they call 'snow in space'.
Watch the first 1 minute and 33 seconds. It perfectly visualizes how low-probability, high-energy samples (rays hitting the small lights) create extreme noise.
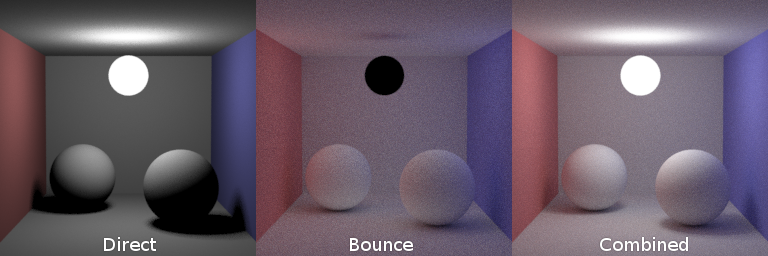
Indirect lighting (light that has bounced at least once) is particularly prone to this. The direct light from a source can often be calculated quite accurately, but the bounced light relies entirely on the Monte Carlo estimation of where that light goes next.
Test your understanding!
Imagine you are rendering two simple scenes with a path tracer, using 64 samples per pixel for both:
- Scene A: A single sphere inside a large, hollow sphere that glows softly and evenly from its entire inner surface (like being inside a frosted light bulb).
- Scene B: The same single sphere in a pitch-black room, lit by a single, tiny, intensely bright point light.
Which scene would you expect to have more visual noise, and why? Explain your reasoning in terms of Monte Carlo variance.
Show answer
Scene B would be significantly noisier.
Here's why:
- In Scene B, the light energy is concentrated in a tiny area. With a uniform sampling strategy, the probability of any given ray hitting the light source is extremely low.
- Most samples will contribute zero light, but the few that do hit the light will contribute a massive amount. This huge difference between sample values leads to very high variance in the Monte Carlo estimator for each pixel. The result is a "firefly" effect and a grainy image.
- In Scene A, the light energy is distributed smoothly and evenly across the entire hemisphere. No matter which direction a sample ray is cast, it will hit a lit surface and contribute a similar amount of light. The values of the samples are all close to each other, resulting in low variance and a much cleaner image, even with the same number of samples.
Conclusion
In this lesson, we have formally connected the dots between the random sampling process of path tracing and the resulting visual noise in the final image.
Key Takeaways:
- Visual noise in a path-traced image is a direct manifestation of statistical variance in the Monte Carlo estimation of pixel color.
- Variance arises because we are averaging the results of random paths, and the light contribution from each path can differ significantly.
- Noise decreases proportionally to the square root of the number of samples (), meaning we must quadruple the samples to halve the noise.
- High variance occurs when our sampling strategy has a low probability of finding high-energy contributions, such as small, bright light sources. This results in "fireflies" and excessive grain.
Next Steps
We have now thoroughly diagnosed the problem: noise is variance. Brute-forcing more samples is a solution, but it's incredibly inefficient. The formula for variance, , points to a much more elegant solution. Instead of just increasing , what if we could reduce the variance term itself?
In our next lesson, we will begin our exploration of importance sampling. You will learn how to design "smarter" sampling strategies () that are more likely to find the important, high-energy paths of light. This is the key to dramatically reducing noise and is a cornerstone of all modern production renderers.