Hello! Welcome to the final lesson in our module on data transformation.
In our previous session, we explored how to use the Group By feature to summarize vast amounts of data into concise, high-level tables. This is a powerful way to get answers from data that is already well-structured.
However, data in the real world is often formatted for human readability or data entry, not for analysis. A very common example is data laid out in a "crosstab" or "wide" format, with categories spread across columns (like months, products, or survey questions). This structure makes analysis in tools like Excel PivotTables or Power BI extremely difficult.
Today's lesson addresses this exact problem, focusing on the learning outcome: Unpivot data to transform it into a usable format for analysis. We'll learn how to take that wide, inflexible data and reshape it into a "long," analysis-friendly format. For the managers in your workshop, this is one of the most transformative skills they can learn, as it unlocks the ability to analyze countless reports they encounter in their daily work.
By the end of this lesson, you will be able to teach your audience:
- The difference between "wide" (pivoted) and "long" (unpivoted) data formats.
- Why the "long" format is superior for analysis.
- How to use the Unpivot feature in Power Query to reshape their data.
- How to choose the most robust unpivot method to handle future data updates automatically.
Why Unpivot? Understanding Data Shapes
The first step in teaching this concept is to build a clear mental model of the "problem" format versus the "solution" format.
-
Pivoted or "Wide" Data: Has values belonging to the same category spread across multiple columns. Think of a sales report with separate columns for "Jan Sales," "Feb Sales," and "Mar Sales." This is easy for a person to read, but a computer can't easily analyze "sales over time" because there is no single "Sales" column or "Month" column.
-
Unpivoted or "Long" Data: Stacks these values into fewer columns. The same sales report would have a "Month" column and a "Sales" column. Each row would represent the sales for a specific month. This structure is perfect for analysis tools.
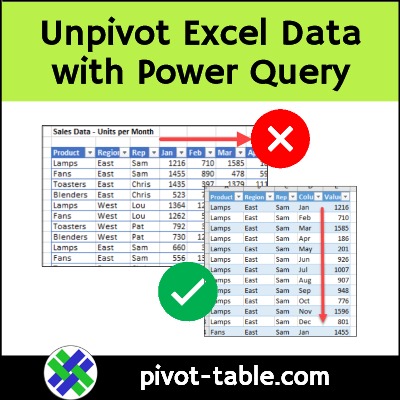
To help your workshop participants grasp why this matters, it's effective to show them the limitations of the "wide" format. This short video does an excellent job of explaining the problem.
Why Data Analysis Needs Proper Tables and Power Query’s UnPivot Feature. Excel Magic Trick 1886
The video 'Why Data Analysis Needs Proper Tables' from the excelisfun channel quickly explains why the common 'cross-tab' layout is not a 'proper table' for analysis. This is the core 'why' that will motivate your audience.
Watch the first minute (00:00 - 01:07). The speaker clearly articulates that while a wide table looks like a table, it's not structured for analysis tools and shows what the proper, unpivoted structure looks like.
The Unpivot Operation in Power Query
Power Query provides a powerful and intuitive way to fix this problem. On the Transform tab, you'll find the Unpivot Columns command. It comes in three main variations:
- Unpivot Columns: Unpivots the columns you have selected.
- Unpivot Other Columns: Unpivots all columns except the ones you have selected.
- Unpivot Only Selected Columns: Unpivots the columns you have selected (similar to the first option, but with subtle differences in the underlying code).
For your workshop, "Unpivot Other Columns" is the most important one to teach. You select the columns that are already correct (e.g., Date, Region, Product ID), and tell Power Query to unpivot everything else. This method is highly robust; if a new column (like a new month's data) is added to the source file, Power Query will automatically include it in the unpivot operation upon refresh. This "future-proofs" the report, a key benefit for managers.
Let's dive into the official documentation to solidify the concept of "Unpivot Other Columns."
The official Microsoft documentation, 'Unpivot columns', provides a clear definition and comparison of the different unpivot commands. Understanding the difference is key to building robust queries.
Read the introductory section and the section titled 'Unpivot other columns'. Pay close attention to the 'Special considerations' part, which explains how this command handles new columns added to your source data later. This is a crucial point to teach for building future-proof reports.
Practical Walkthrough: Reshaping a Sales Report
Now let's see this in action. The following video demonstrates a classic scenario: transforming a sales report with product categories as columns into an analysis-ready table.
How and why to Unpivot data with Power Query
The video 'How and why to Unpivot data with Power Query' from Access Analytic provides an excellent real-world demonstration. The first part walks through a classic example of unpivoting monthly sales data.
Watch from the beginning to 04:33. Notice how the presenter first shows the problem this data format causes in a PivotTable, then solves it in Power Query using 'Unpivot Other Columns', and finally shows the flexibility of the new data structure.
To complement the video, here is a breakdown of the steps you can teach, which you can also use as a reference for your workshop materials.
The Unpivot Workflow:
- Load Data: Import your Excel or CSV file into the Power Query Editor.
- Select Anchor Columns: Identify the columns that should not be unpivoted. These are your descriptive columns, like
OrderID,CustomerName, orDate. Select them by clicking their headers (useCtrl+click for multiple columns). - Unpivot Other Columns: Right-click on any of the selected column headers and choose Unpivot Other Columns.
- Rename New Columns: Power Query will create two new columns: "Attribute" (containing the former column headers) and "Value" (containing the cell values). Rename them to something meaningful, like "Product" and "Sales."
- Set Data Types: Ensure all columns have the correct data type (e.g., Text, Whole Number, Date).
- Close & Load: Load the transformed, analysis-ready data back into Excel or into your Power BI model.
This process is also detailed in the following guide, which is a great resource to have on hand.
How to Unpivot Excel Data: Beginner Guide-Power Query
For a detailed, step-by-step guide that you can refer back to, the 'How to Unpivot Excel Data' article from Contextures is very helpful. It breaks down the process into clear actions.
Review the sections 'Start Unpivot Steps', 'Power Query Editor Steps' (especially step 5, 'Unpivot the Data'), 'Rename Columns', 'Detect Data Type', and 'Load Revised Data'. This covers the full workflow and reinforces what you saw in the video.
Test your understanding!
You have a dataset of employee performance reviews with the following columns: Employee ID, Employee Name, Q1 Score, Q2 Score, Q3 Score, Q4 Score.
You want to analyze performance trends across the year. How would you unpivot this data, and what would the final columns of your analysis-ready table be?
Show answer
- Select Anchor Columns: Select the
Employee IDandEmployee Namecolumns. - Unpivot: Right-click one of the selected headers and choose Unpivot Other Columns.
- Rename: Rename the new "Attribute" column to
Quarterand the "Value" column toScore. - Final Columns: The final table will have four columns:
Employee ID,Employee Name,Quarter, andScore. This format allows you to easily create charts showing score trends over time for each employee.
Advanced Scenario: When Unpivot Gets Complicated
While "Unpivot Other Columns" solves most common problems, you should be aware of more complex scenarios. Sometimes, a table contains mixed measures that, if unpivoted directly, would lead to incorrect aggregations.
The second half of the video from Access Analytic introduces such a case. The solution involves data modeling concepts—splitting the query into separate, related tables before unpivoting.
How and why to Unpivot data with Power Query
Now for a more advanced topic. Sometimes, a simple unpivot won't work correctly if your table contains mixed data types or measures. This video tackles such a problem by first splitting the data.
Watch from 04:33 to the end. You don't need to master this for a beginner workshop, but it's important for you, as the instructor, to be aware that these situations exist and that the solution lies in more advanced data modeling.
For your 2-day workshop, focusing on the standard unpivot is sufficient. This advanced topic is for your own knowledge, enabling you to confidently answer "what if" questions from more curious participants.
Conclusion
You now have a complete picture of how to teach one of the most essential data transformation techniques. Reshaping data with Unpivot is often the magic step that makes meaningful analysis possible.
Key Takeaways for Your Workshop:
- Identify the Problem: Teach managers to recognize "wide" data (e.g., months or categories as columns) and understand why it limits their ability to analyze.
- The Goal is "Long" Data: The solution is to transform it into a "long" or "proper" table with attribute and value columns.
- "Unpivot Other Columns" is Your Go-To: It's intuitive, powerful, and robustly handles updates to the source data.
- Follow the Simple Workflow: Select anchors -> Unpivot Others -> Rename -> Check types.
Preview of the Next Lesson:
With this lesson, we conclude our deep dive into data cleaning and transformation in Power Query. We now know how to get data, clean it, apply business logic, and shape it into the perfect format. We are finally ready for the fun part! In the next module, we will import our cleaned data into Power BI and begin building our first interactive reports. We'll start by navigating the Power BI interface and creating fundamental visuals like bar charts and line charts to bring our data to life.