Hello! Welcome to your next lesson.
In our previous session, we categorized data into structured, unstructured, and semi-structured types. You are now prepared to teach managers how to identify the kinds of data they have. However, knowing the type of data is only half the battle. A massive, perfectly structured database is useless if the information within it is wrong.
This brings us to our current learning outcome: to identify common data quality issues that affect analysis. This concept is famously summarized by the phrase "Garbage In, Garbage Out" (GIGO). For any AI or analytics project to be successful, the input data must be clean, accurate, and reliable. This lesson will equip you to explain the most common data problems and, crucially, how to spot them using the tools your audience will be learning.
The Cost of "Dirty" Data
Before diving into specifics, it's important to frame the problem for a management audience. Poor data quality isn't just a technical inconvenience; it has a real and significant financial impact on a business.
To set the stage, let's start with a short, effective analogy.
The video 'Data Quality Explained' by IBM Technology opens with a perfect analogy comparing a chef with poor quality ingredients to a business with poor quality data. This is a powerful way to introduce the topic to a non-technical audience.
Please watch the first 37 seconds of the video. Notice how it immediately connects data quality to business reputation and outcomes.
As the video highlights, even the best team and tools can't produce good results from bad "ingredients." The Google video "Understanding Data Cleaning" (resource ID: LINK) estimates this cost to be trillions of dollars for the US economy alone. For your workshop, framing data quality as a matter of risk management and financial prudence will resonate strongly with managers.
The Core Dimensions of Data Quality
Data quality is not a single concept but a collection of attributes. For your workshop, it's useful to break it down into a few key dimensions. This visual provides a clear framework.
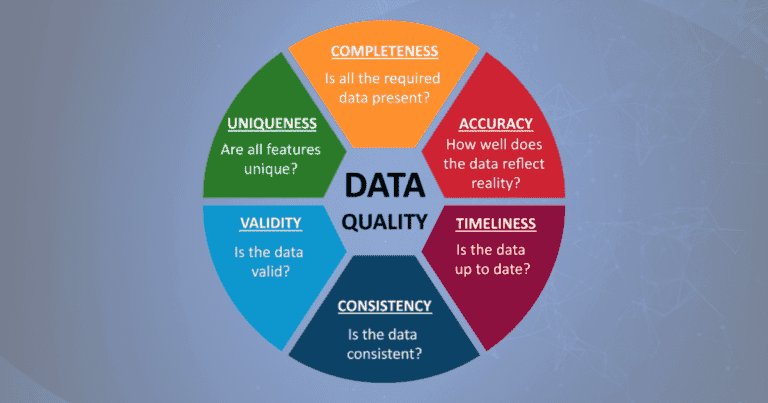
Let's briefly define these dimensions, which you can then explain to your audience:
- Completeness: Is all the necessary data present? Are there missing values?
- Accuracy: Does the data correctly reflect the real world? Is a customer's address correct?
- Consistency: Is the data uniform across different systems and tables? Is "United States" recorded as "USA" in one file and "U.S." in another?
- Uniqueness: Is each record or entity represented only once? Are there duplicate customer entries?
- Timeliness: Is the data up-to-date and available when needed? Are you making decisions based on last year's sales figures?
- Validity: Does the data conform to the rules and constraints of its field? (e.g., a date in a date column, an email address in the correct format).
The IBM video you just saw also provides clear explanations for four of these core concepts.
Let's continue with the IBM video to get simple, business-oriented definitions for Accuracy, Completeness, Consistency, and Uniqueness.
Watch from 00:47 to 03:20. Pay attention to the simple examples provided for each dimension, such as bot traffic for accuracy or different zip code formats for consistency.
A Gallery of Common Data Quality Issues
Now let's create a "rogue's gallery" of the specific problems that arise when data fails to meet these quality dimensions. Understanding these specific issues will help managers know what to look for in their own departments.
The following article provides an excellent, manager-friendly overview of these problems.
7 Common Data Quality Issues (and How to Solve Them)
The article '7 Common Data Quality Issues' from Gable.ai provides a well-structured list of the most frequent data problems, complete with examples and their business impact. It's a great resource for structuring this part of your workshop.
Please read the sections from '1. Human error' through '5. Inaccurate data'. Focus on the 'Examples' and 'Impact' for each issue, as these are the key points to convey to your audience.
Based on that reading and other resources, here is a summary of the key issues to present in your workshop:
-
Duplicate Data: The same record appears multiple times.
- Example: A customer is entered twice with slightly different spellings of their name, or a sales transaction is accidentally recorded twice.
- Impact: Skewed sales reports, wasted marketing spend (contacting the same person twice), and inventory errors.
-
Incomplete Data (Missing Values or Nulls): Fields that should contain information are left blank.
- Example: A customer record is missing a phone number or email address, or a product record is missing its price.
- Impact: Inability to contact customers, flawed analysis (you can't calculate total sales if prices are missing), and poor user experience.
-
Inconsistent Data: The same data point is represented in different ways across your dataset.
- Example: Storing dates as "12/31/2023" in one file and "Dec 31, 2023" in another. Using state abbreviations like "CA" in some records and the full name "California" in others.
- Impact: Difficulty in merging data from different sources, incorrect grouping and filtering, and misleading reports.
-
Inaccurate or Invalid Data: The data is present but factually wrong or doesn't conform to the expected format.
- Example: A customer's age is listed as "150", a product price is entered as a negative number, or an email address is just "johnsmith" with no "@" symbol. This is often caused by human error during data entry.
- Impact: Failed deliveries from wrong addresses, incorrect financial calculations, and system errors when data types don't match (e.g., text in a number field).

Test your understanding!
Imagine you receive a simple Excel spreadsheet of daily product sales. You notice the following problems. For each one, identify which data quality issue it represents.
- Two rows are identical in every way:
Order #101, Product 'A', 10 units, $500. - In the
Customer Statecolumn, you see entries forTX,Tx., andTexas. - Several rows are missing a value in the
Order Datecolumn. - One row has "N/A" written in the
Units Soldcolumn, which should be a number.
Show answer
- Duplicate Data. The entire record is repeated, which could lead to an overstatement of sales.
- Inconsistent Data. The same state is represented in three different formats, which would prevent you from correctly grouping all sales for Texas.
- Incomplete Data. The missing order dates make time-based analysis (e.g., sales per month) impossible for those records.
- Invalid Data. The
Units Soldcolumn has a text string where a number is expected. This will cause errors in any calculations performed on that column.
From Theory to Practice: Spotting Issues in Power Query
For your workshop, it's essential to move from discussing these issues abstractly to showing managers how to find them. This is where you'll introduce the tools in Excel and Power BI. Power Query has excellent built-in Data Profiling tools for this exact purpose.
Please read the following documentation from Microsoft to understand these features.
Using the data profiling tools - Power Query
This official Microsoft documentation, 'Using the data profiling tools', explains the three key features in Power Query that help you visually identify data quality issues at a glance.
Read the introductory section and the sections titled 'Column quality' and 'Column distribution'. Pay close attention to how these features are enabled in the 'View' tab and what the visuals represent.
Here's how you can connect the data quality issues we've discussed to what managers will see in Power Query's Data Profiling panes:
-
Column Quality: This view gives a quick, color-coded bar for each column.
- The dark grey (Empty) portion directly shows you Incomplete Data. A column with a large grey bar has many missing values.
- The red (Error) portion shows Invalid Data. This happens when the data doesn't match the column's type (e.g., text in a number column).
-
Column Distribution: This view shows a histogram of the most frequent values in a column.
- It's a powerful tool for spotting Inconsistent Data. If you see "TX", "Tx.", and "Texas" as three separate bars in the distribution chart for a
Statecolumn, you've found an inconsistency. - It also helps identify potential Duplicates and understand the uniqueness of your data. The
distinctanduniquevalue counts are crucial here. If a column that should be unique (likeOrderID) has fewer unique values than distinct values, you have duplicates.
- It's a powerful tool for spotting Inconsistent Data. If you see "TX", "Tx.", and "Texas" as three separate bars in the distribution chart for a
By teaching managers to enable and interpret these simple visuals, you empower them to quickly diagnose the health of their data without writing a single line of code.
Conclusion
You are now ready to teach a comprehensive lesson on identifying data quality problems. This is a critical prerequisite before any meaningful analysis or AI work can begin.
Key Takeaways for Your Workshop:
- Poor data quality costs businesses real money and leads to bad decisions ("Garbage In, Garbage Out").
- The most common data problems are duplicates, incomplete data, inconsistent data, and inaccurate/invalid data.
- These issues can be easily spotted without code using the Data Profiling tools in Power Query, specifically the Column Quality and Column Distribution features.
Preview of the Next Lesson:
We have now discussed the types of data and the quality of data. In our next lesson, we will address the final foundational data concepts: the importance of data volume and variety for AI applications. We'll explore why AI models often need large and diverse datasets to be effective.