Hello! In our last few lessons, we've covered the fundamentals of creating React applications. You've learned to:
- Write UI with JSX.
- Build reusable functional components.
- Render your main
Appcomponent to the DOM.
This gives you a complete workflow for building a static React page. But what happens when your application grows more complex and you need to understand what's happening under the hood? How do you debug a component that isn't displaying the right information?
Today, you'll learn how to use a professional developer's most essential companion for React: the React Developer Tools. This lesson will empower you to look inside your running application, inspect its structure, and see how data flows through it. By the end, you will be able to use the DevTools to inspect your application's component hierarchy and its state.
What are React Developer Tools?
As a frontend developer, you're already familiar with your browser's built-in developer tools, especially the "Elements" tab that shows the HTML DOM tree. React DevTools is a browser extension that adds two new tabs—Components and Profiler—that are specifically designed for inspecting React applications.
Think of the "Components" tab as an X-ray for your app. Instead of seeing raw HTML tags like <div> and <span>, you see your component tree: <App>, <Navbar>, <UserProfile>, etc. This allows you to debug your application in terms of the components you actually wrote.
1. Installing React DevTools
First things first, you need to install the browser extension. It's available for all major browsers.
How to Use React Developer Tools (With Example)
The Codecademy article 'How to Use React Developer Tools' provides a concise guide to getting started. We'll use it to walk through the installation.
Please read the section 'How to install React DevTools'. Follow the steps to add the extension to your browser. You don't need to read the rest of the article just yet.
Once installed, if you open a website built with React (including the one running on your localhost), you should see the React logo in your browser's extension bar light up.
2. Inspecting the Component Hierarchy
Now that you have the tools, let's put them to use. In your browser, open the developer tools (usually by right-clicking and selecting "Inspect" or pressing F12/Cmd+Opt+I) and click on the "Components" tab.
You will see a tree structure that mirrors the nesting of your React components.
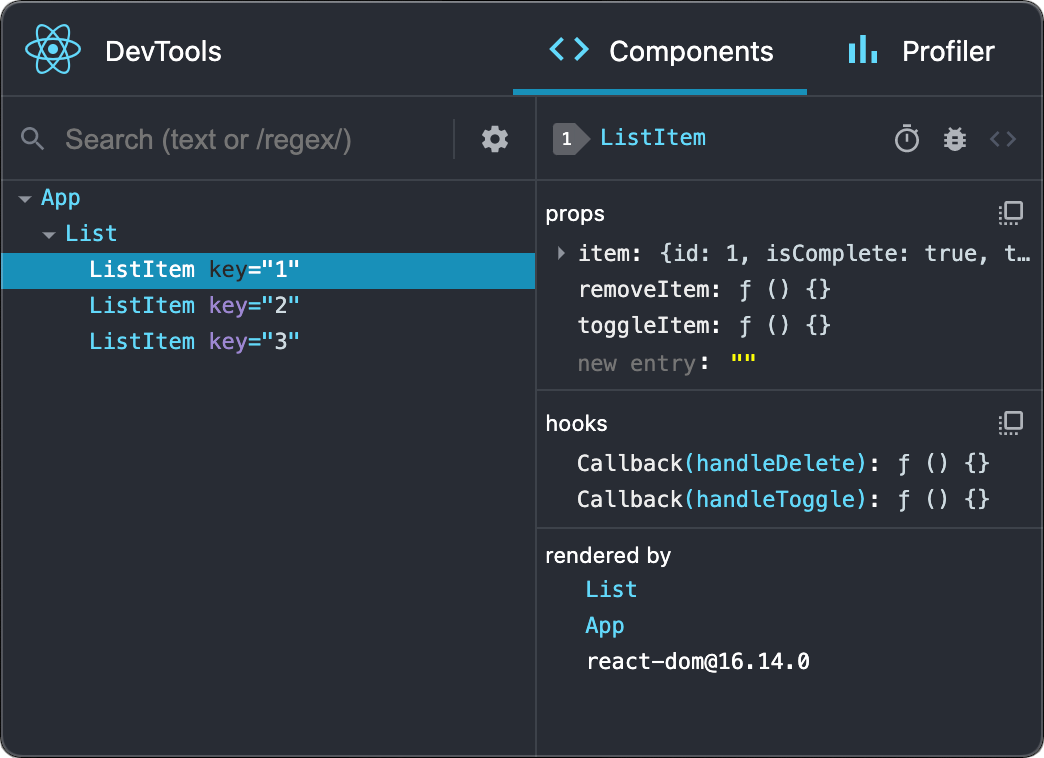
To see something more interesting than just the <App> component, let's add a bit of interactivity. Open your src/App.jsx file and replace its contents with the following code. Don't worry about understanding every line just yet; we'll cover useState in detail in a later module. For now, think of it as a way to give a component its own "memory" or "state".
import { useState } from 'react';

function Counter() {
  // useState is a "Hook" that lets you add state to a component.
  const [count, setCount] = useState(0);

  return (
    <div style={{ border: '1px solid #ccc', padding: '10px', margin: '10px' }}>
      <h2>My Counter</h2>
      <p>You clicked {count} times</p>
      <button onClick={() => setCount(count + 1)}>
        Click me
      </button>
    </div>
  );
}

function App() {
  return (
    <div>
      <h1>Welcome to My App</h1>
      <p>This app has a counter component.</p>
      <Counter />
      <Counter />
    </div>
  );
}

export default App;
Now, run your app (npm run dev) and look at the "Components" tab again. You should see your <App> component, which now contains two <Counter> components. Each <Counter> is an independent instance with its own state.
3. Inspecting State and Props
This is where the real power of the DevTools becomes apparent.
- In the "Components" tab, click on one of the
<Counter>components in the tree. - On the right-hand panel, you will see a section named
hooks. - Inside, you'll find a
Statehook, which shows the current value of thecountvariable for that specific component instance. Initially, it will be0. - Now, go back to your app in the browser and click the button inside that counter a few times.
Notice how the State value in the DevTools updates in real-time! This is incredibly powerful for debugging. You can directly observe the internal state of any component without adding a single console.log.
The following video provides an excellent walkthrough of these features.
Full React Tutorial #9 - Intro to React Dev Tools
The Net Ninja provides a quick and clear introduction to the DevTools, demonstrating how to inspect the component tree and watch state changes.
Watch from 00:30 to 03:50. The video will walk you through navigating the component tree and, most importantly, show you how the 'hooks' panel reflects state changes as you interact with the application.
4. Editing State and Props for Rapid Debugging
Inspecting state is useful, but the DevTools take it a step further: they let you modify state and props on the fly. This allows you to test how your component would behave in different scenarios without changing your code and reloading the page.
- Editing State: With a
<Counter>component selected, find itsStatein thehookspanel. You can click on the value (e.g.,3) and type a new number, like50, and press Enter. You'll see the UI update instantly! - Editing Props: While our
<Counter>doesn't have props, if it did, they would appear in apropssection. You could edit string values, toggle booleans (true/false), and see how the component reacts.
This next video demonstrates this "live editing" capability very effectively.
The Best React Helper Tool - React Dev Tools Tutorial
This tutorial by PedroTech offers a fantastic demonstration of the power of editing props and state directly within the DevTools for debugging.
Watch from 04:27 to 08:00. Pay close attention to how he modifies a component's props to change the displayed text and then modifies a counter's state value directly in the DevTools.
Test your understanding!
Let's modify our App.jsx slightly. Add a new piece of state to the Counter component to track a name.
import { useState } from 'react';

function Counter() {
  const [count, setCount] = useState(0);
  const [name, setName] = useState("User"); // New state variable

  return (
    <div style={{ border: '1px solid #ccc', padding: '10px', margin: '10px' }}>
      <h2>Counter for: {name}</h2>
      <p>You clicked {count} times</p>
      <button onClick={() => setCount(count + 1)}>
        Click me
      </button>
    </div>
  );
}

// ... rest of the App component is the same
- After running this new code, select a
<Counter>component in the DevTools. What do you see in thehookspanel? - Use the DevTools to change the
namestate to your own name. What happens in the browser view?
Show answer
- In the
hookspanel, you will now see twoStateentries. The first corresponds to thecountstate (a number), and the second corresponds to thenamestate (a string, initially "User"). - When you edit the
namestate value in the DevTools and press Enter, the<h2>heading for that specific counter component will immediately re-render on the screen to display your name. This demonstrates how you can test component behavior with different data types.
Conclusion
You've just added a critical tool to your React development toolkit. Mastering the React DevTools will save you countless hours of debugging and give you a much deeper understanding of how your applications work.
Let's summarize the key takeaways:
- React DevTools is a browser extension that adds Components and Profiler tabs to your browser's developer tools.
- The Components tab shows your application's component hierarchy, which is more intuitive for debugging than the raw HTML DOM.
- You can select any component to inspect its props and state (via the
hookspanel). - State and props can be edited in real-time within the DevTools, allowing you to quickly test component behavior under different conditions.
We've only scratched the surface of the "Components" tab, and we haven't even touched the "Profiler" tab (which is used for performance optimization and is a topic for a much later lesson). For now, practice using the inspector on every component you build. It will soon become second nature.
This lesson concludes our first module on React Fundamentals. In our next lesson, we will begin a new module by officially learning about props, the mechanism React uses to pass data from parent components to child components, making them truly reusable and dynamic.