Introduction
In our last lesson, we investigated how unexpected inflation creates "winners" and "losers" by redistributing wealth between borrowers and lenders. We saw how this follows from the difference between the ex-ante and ex-post real interest rates. This lesson moves to another crucial macroeconomic indicator: the labor market.
Our objective is to calculate the unemployment rate and classify unemployment as frictional, structural, or cyclical. We will begin by defining the key statistical categories used to measure the labor force and then perform the necessary calculations. Your background in statistics will be valuable in appreciating the precise definitions and potential measurement issues. We will then categorize unemployment into its main types, which is essential for understanding its causes and potential policy remedies. Finally, we'll explore a simple dynamic model that describes the flow between employment and unemployment, allowing us to derive the long-run "natural" rate of unemployment from first principles.
Measuring Unemployment
To calculate the unemployment rate, we first need to understand how economists and statisticians classify the population. The population is divided into several key groups.
- Employed (E): People who are currently holding a job.
- Unemployed (U): People who are not employed but are actively looking for work and are available to start.
- Labor Force (LF): The sum of the employed and the unemployed. . These are the people who are economically active.
- Not in the Labor Force: People of working age who are not employed and are not actively looking for work. This includes full-time students, retirees, stay-at-home parents, and discouraged workers—individuals who have given up looking for a job.
The unemployment rate is the percentage of the labor force that is unemployed:
Another key statistic is the labor force participation rate, which measures the share of the working-age population that is in the labor force:
The following video provides a concise visual overview of these categories and the formulas.
This video, "Unemployment- Macro Topic 2.3" by Jacob Clifford, offers a clear and dynamic explanation of how unemployment is measured and discusses some of the important nuances in the official statistics.
First, watch the segment that explains the basic calculations. Pay attention to how the labor force is defined. Next, watch the segment on the problems with the unemployment rate. This covers the important issues of underemployment and discouraged workers.
As the video highlights, the official unemployment rate can sometimes be misleading. A person working one hour a week is counted as fully employed, and if many unemployed people become discouraged and stop looking for work, the unemployment rate will fall, even though the labor market situation has arguably worsened.
Practice Calculation
Let's apply these formulas. The image below presents data for a hypothetical economy. Use this data to answer the questions that follow.

- What is the size of the Labor Force?
- Calculate the unemployment rate (%).
- Calculate the labor force participation rate (%). Assume the "Under Age 16..." group is not part of the working-age population.
- Now, consider question 4 from the image: If 20 people move from the "unemployed" category to the "not in the labor force" category (becoming discouraged workers), what is the new unemployment rate? How does this illustrate the "discouraged worker" problem?
Click here for the solution.
1. Labor Force:
The labor force is the sum of employed and unemployed individuals.
2. Unemployment Rate:
3. Labor Force Participation Rate:
The working-age population is the Total Population minus those under 16, in the military, or institutionalized.
4. Discouraged Worker Effect:
- New Unemployed:
- New "Not in the Labor Force":
- The number of Employed remains 270.
- New Labor Force:
- New Unemployment Rate:
The unemployment rate fell from 20.6% to 15.6%, suggesting an improvement. However, this was caused by people giving up on finding a job, which reflects a worsening of labor market conditions. This shows how changes in the unemployment rate must be interpreted with caution.
Classifying Types of Unemployment
Not all unemployment is the same. Economists distinguish between three main types, based on the underlying cause.
- Frictional Unemployment: Short-term unemployment experienced by individuals who are transitioning between jobs or entering the labor market for the first time (e.g., recent graduates). This is a natural feature of a dynamic labor market where workers search for jobs that best match their skills.
- Structural Unemployment: Longer-term unemployment caused by a mismatch between the skills workers have and the skills employers need. This often arises from technological changes, shifts in consumer demand, or globalization that makes certain industries or skills obsolete.
- Cyclical Unemployment: Unemployment that arises due to downturns in the business cycle (recessions). When the economy contracts, firms lay off workers due to falling demand for their products and services.
Frictional and structural unemployment are always present to some degree, even in a healthy economy. Their sum is referred to as the natural rate of unemployment. An economy is considered to be at full employment when there is no cyclical unemployment; the actual unemployment rate is equal to the natural rate.
The video from Jacob Clifford provides a helpful analogy to remember these types.
This final segment from the "Unemployment" video explains the three types of unemployment using the memorable "dumpster fire" analogy.
Please watch the section from "three types of unemployment" to the end.
For a more detailed textual explanation of these concepts, the following resource is useful.
Types of Unemployment: Videos & Practice Problems - Pearson
This text from Pearson provides clear definitions and examples for each type of unemployment and formally defines the natural rate of unemployment.
First, read the section Frictional, Structural, and Cyclical Unemployment. This will solidify the definitions. Then, read the short section under Definition of Full Employment to understand how these concepts relate to the natural rate.
Practice Classification
Let's test your ability to classify unemployment with a few scenarios.
-
Workers at a car manufacturing plant are laid off because the economy is in a recession and demand for new cars has fallen sharply. What type of unemployment is this?
- (a) Frictional
- (b) Structural
- (c) Cyclical
-
A recent university graduate with a degree in software engineering is spending a few weeks interviewing with several tech companies to find the best job offer. What type of unemployment are they experiencing?
- (a) Frictional
- (b) Structural
- (c) Cyclical
-
Coal miners in a region lose their jobs as the country shifts its energy production towards renewable sources, making coal mining obsolete. What type of unemployment is this?
- (a) Frictional
- (b) Structural
- (c) Cyclical
Click here for the answers.
1. **(c) Cyclical.** The job losses are tied directly to an economic downturn (recession). 2. **(a) Frictional.** This is a short-term period of job searching between finishing education and starting a career. 3. **(b) Structural.** There is a fundamental mismatch between the miners' skills and the skills now in demand in the energy sector.The Bathtub Model of Unemployment
We can move beyond static classification and model the dynamics of unemployment using a framework that should appeal to your statistical background. The "Bathtub Model" views the labor market as a system of flows between two states: Employed (E) and Unemployed (U).
- A fraction of employed people lose their jobs each period. This is the job separation rate (s).
- A fraction of unemployed people find a job each period. This is the job finding rate (f).
The change in the number of unemployed people from one period to the next is the flow into unemployment minus the flow out of unemployment:
In the long run, the labor market reaches a steady state where the number of unemployed people is constant (). In this equilibrium, the flow into unemployment equals the flow out:
Where and are the steady-state levels of employment and unemployment.
Since the total labor force is fixed (), we can substitute .
We want to find the steady-state unemployment rate, . Rearranging the equation:
This elegant result shows that the natural rate of unemployment is determined by the rates of job separation and job finding.
The following text provides a formal walkthrough of this derivation.
6 The Labor Market and Unemployment
This section from a set of lecture notes by François Geerolf provides a rigorous derivation of the bathtub model and its steady-state solution.
Please read the section titled "The Bathtub Model" for the initial setup. Then, follow the derivation under the "Solution" heading, which derives the key formula u^* = s/(s+f). Pay close attention to how the steady-state condition (inflow = outflow) is used to solve for the unemployment rate.
Practice with the Bathtub Model
This final exercise uses the formula we just derived.
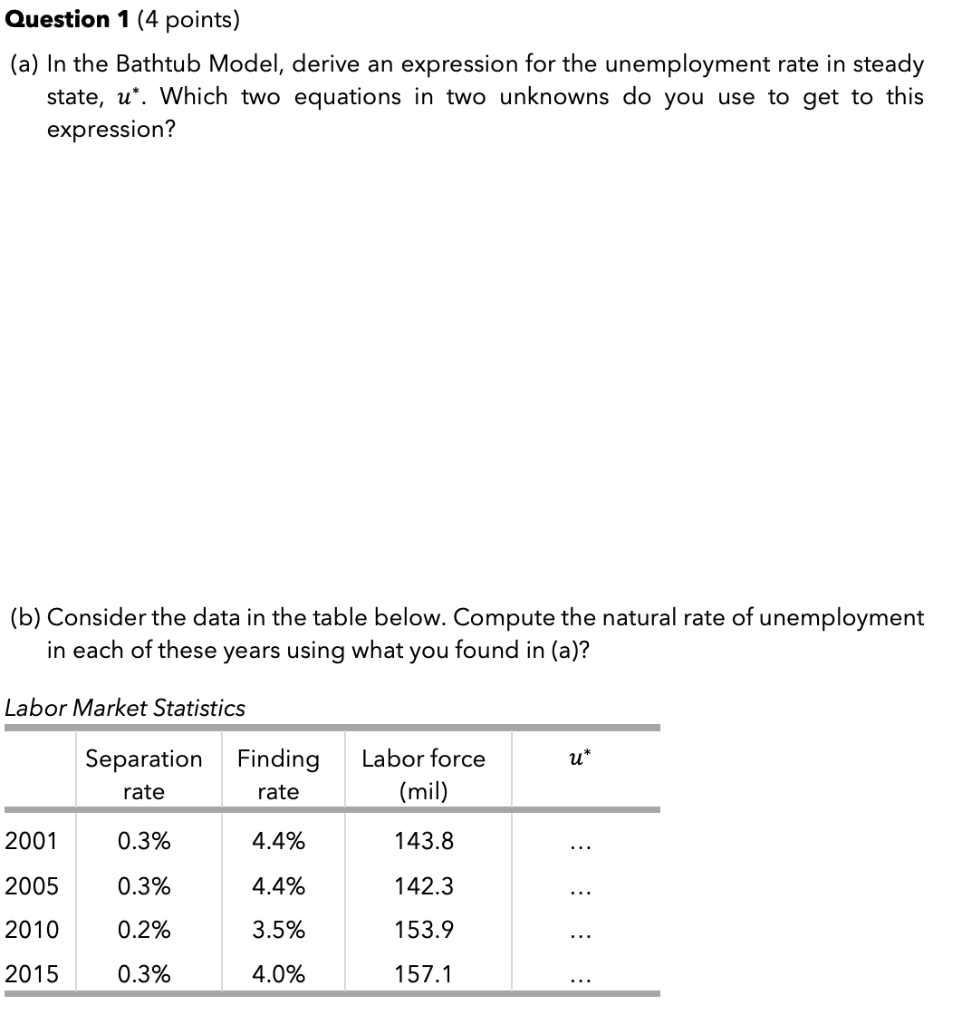
Using the formula you derived, , complete part (b) of the question in the image. Calculate the natural rate of unemployment () for each of the years from 2001 to 2015 using the provided separation and finding rates.
Click here for the solution.
- 2001: ,
- 2005: ,
- 2010: ,
- 2015: ,
Conclusion
In this lesson, we have moved from the conceptual to the quantitative in our analysis of unemployment. We've defined the statistical basis for its measurement and seen how to calculate the official unemployment rate, while also noting its limitations. We then established the critical distinction between frictional, structural, and cyclical unemployment, which helps diagnose the health of the labor market.
Key Takeaways:
- The unemployment rate is the percentage of the labor force () that is unemployed.
- Changes in the labor force, such as those caused by discouraged workers, can make the unemployment rate a noisy signal of labor market health.
- Unemployment is classified as frictional (job transitions), structural (skill mismatch), or cyclical (recession-driven).
- The natural rate of unemployment is the sum of frictional and structural unemployment and corresponds to the state of full employment.
- The Bathtub Model provides a dynamic view of the labor market, showing that the steady-state or natural rate of unemployment is determined by the job separation rate () and the job finding rate (), with .
We have now covered GDP, inflation, interest rates, and unemployment. In the next lesson, we will explore the relationship between two of these key variables by calculating the inflation-unemployment trade-off implied by a given Phillips curve equation. This will be our first look at a formal model linking two major macroeconomic outcomes.