Welcome back. In the previous lesson, you built a pytest safety net around numerical code: parametrized behavioral cases, fixtures for clean setup, and reliable error checks. That safety net matters now because performance work changes how code executes; tests verify that it still computes the same result.
This final lesson in the Python foundations module is about replacing performance guesses with evidence. You will profile a representative program, interpret function-level CPU-time reports, inspect line-level memory behavior, and write a defensible bottleneck diagnosis. These habits transfer directly to data preprocessing, tokenization, training loops, and eventually the LLM-VLM service.
Performance is an empirical question
A program can feel slow for very different reasons:
- a Python loop repeatedly performs expensive work;
- an algorithm makes a costly lookup or allocation at each iteration;
- a function creates several large intermediate arrays or lists;
- the program is waiting for disk, network, or another process;
- in later GPU workloads, the CPU is idle while asynchronous device work runs.
The first rule is therefore:
Measure before changing code.
A useful workflow has three stages:
- Measure a real workload.
- Diagnose why the dominant cost occurs.
- Treat only the measured cause, then verify correctness and measure again.
Profiling — Python for Scientific Computing documentation
Read this short overview from Python for Scientific Computing. It establishes the measure-diagnose-treat discipline and explains why input scale affects what a profiler reveals.
In the section “Key steps of optimization,” read the three-step workflow. Treat a profile as evidence for a diagnosis, not as an instruction to rewrite every visibly expensive line. Then, in “Scale matters for profiling,” read the warning about input size. Focus on why a tiny synthetic input may hide the bottleneck that matters in production.
For AI engineering, a representative workload means more than “the program runs.” It should resemble the request or data volume you will actually handle:
- tokenize a realistic-length batch of prompts rather than one short string;
- process images at the intended resolution;
- use a plausible number of records or documents;
- include the preprocessing, serialization, or disk access that the real pipeline performs.
At the same time, control the workload. Fix the input file, random seed, batch size, and configuration. If each run performs different work, profile comparisons become weak evidence.
Performance questions must be specific
Before running a profiler, decide which question you are asking.
| Symptom | Measurement question | Likely tool |
|---|---|---|
| End-to-end preprocessing is slow | Which functions account for execution time? | cProfile |
| One known function is suspicious | Which source line is expensive? | A line profiler such as Scalene |
| The process runs out of RAM | Which line allocates or retains large objects near peak use? | Scalene or a memory profiler |
| A code change claims to be faster | Is it faster across repeated controlled runs? | A benchmark, covered later |
This distinction prevents a common mistake: using a profiler as a microbenchmark. Profilers add measurement overhead; they are for finding where a program spends resources. Later, you will use controlled benchmarking to quantify whether a particular replacement is actually faster.
A profile target: two deliberately different bottlenecks
Consider a compact text-preprocessing script. It has three implementations of “count unique words,” each with different performance behavior.
Create scripts/profile_text.py in your project:
from __future__ import annotations

from pathlib import Path
import re


WORD_PATTERN = re.compile(r"\b\w+\b")


def count_unique_with_list(path: Path) -> int:
    unique_words: list[str] = []

    with path.open("r", encoding="utf-8") as source:
        for line in source:
            for word in WORD_PATTERN.findall(line.lower()):
                if word not in unique_words:
                    unique_words.append(word)

    return len(unique_words)


def count_unique_materialized(path: Path) -> int:
    text = path.read_text(encoding="utf-8")
    words = WORD_PATTERN.findall(text.lower())
    unique_words = set(words)
    return len(unique_words)


def count_unique_streaming_set(path: Path) -> int:
    unique_words: set[str] = set()

    with path.open("r", encoding="utf-8") as source:
        for line in source:
            unique_words.update(
                WORD_PATTERN.findall(line.lower())
            )

    return len(unique_words)


def main() -> None:
    path = Path("data/book.txt")

    list_count = count_unique_with_list(path)
    materialized_count = count_unique_materialized(path)
    streaming_count = count_unique_streaming_set(path)

    assert list_count == materialized_count == streaming_count
    print(f"Unique words: {list_count}")


if __name__ == "__main__":
    main()
Use a sufficiently large plain-text file as data/book.txt. The file must be large enough that distinct-word lookup and allocation behavior become visible, yet small enough to profile repeatedly.
The functions share an output contract, which is why the assertion is valuable. In a real project, you would preserve this contract in pytest tests rather than only in main().
Notice the hypotheses this program invites:
count_unique_with_listmay be slow becauseword not in unique_wordssearches a growing list repeatedly.count_unique_materializedmay use substantial memory becausetext,words, andunique_wordsoverlap in lifetime.count_unique_streaming_setmay avoid the full-text and full-token-list intermediates by processing one line at a time.
These are only hypotheses. A profile determines whether they matter at your chosen input size.
Function-level CPU profiling with cProfile
Python’s standard-library cProfile is the default first tool for a CPU-time investigation. It is a deterministic profiler: it records function-call events and accumulates timing statistics. It requires no third-party installation.
Optimize Your Python Programs: Code Profiling with cProfile
Watch “Optimize Your Python Programs: Code Profiling with cProfile” from NeuralNine for a practical command-line run followed by an in-code pstats workflow.
Watch the command-line workflow to see python -m cProfile produce a function summary. Then watch in-code sorting for the idea of saving profile data and sorting it for inspection. Focus on the difference between total time and time per call rather than the video's artificial example.
Run the script from the project root. Ensure that the artifacts directory exists first.
python -m cProfile -o artifacts/text_cpu.prof scripts/profile_text.py
The -o option writes raw profile data to a file instead of flooding the terminal. You can now inspect the same run in multiple ways.
Create scripts/show_profile.py:
from __future__ import annotations

import pstats
from pstats import SortKey


PROFILE_PATH = "artifacts/text_cpu.prof"


def show_cumulative_time() -> None:
    (
        pstats.Stats(PROFILE_PATH)
        .strip_dirs()
        .sort_stats(SortKey.CUMULATIVE)
        .print_stats(20)
    )


def show_internal_time() -> None:
    (
        pstats.Stats(PROFILE_PATH)
        .strip_dirs()
        .sort_stats(SortKey.TIME)
        .print_stats(20)
    )


if __name__ == "__main__":
    print("\n=== Cumulative time ===")
    show_cumulative_time()

    print("\n=== Internal time ===")
    show_internal_time()
Then run:
python scripts/show_profile.py
The Python Profilers — Python 3.14.2 documentation
Read the relevant parts of the official Python documentation to learn what cProfile measures and how to interpret its report rather than treating the highest-looking number as an automatic optimization target.
In “Introduction to the profilers,” read the distinction between profiling and benchmarking. Next, in “Instant User’s Manual,” read the report-column explanation. Pay particular attention to ncalls, tottime, and cumtime. Finally, in the pstats.Stats discussion, read cumulative-time sorting, then read internal-time sorting. Connect those two sorting modes to the two views printed by show_profile.py.
Reading the important columns
A typical cProfile row has columns like these:
| Column | Meaning | Diagnostic use |
|---|---|---|
ncalls |
Number of calls | Detect unexpectedly repeated work |
tottime |
Time spent in the function body, excluding called subfunctions | Find hot loops and expensive leaf functions |
first percall |
tottime / ncalls |
Separate many cheap calls from a few expensive ones |
cumtime |
Time in the function plus all functions it calls | Find expensive pipeline stages and algorithmic choices |
second percall |
cumtime / primitive calls |
Interpret cumulative cost per non-recursive invocation |
filename:lineno(function) |
Source location | Connect the report to the implementation |
The two main views answer different questions.
Sort by cumulative time to find expensive stages
.sort_stats(SortKey.CUMULATIVE)
If main has a very high cumtime, that does not mean main itself is slow. It may simply delegate work to the three counting functions. Instead, descend into the rows it calls.
In this example, a high cumulative time for count_unique_with_list would support the conclusion that the list-based algorithmic stage dominates end-to-end latency.
Sort by internal time to find direct hotspots
.sort_stats(SortKey.TIME)
This view emphasizes time directly attributable to a function. A high tottime can reveal a function doing repeated local work, such as a Python loop, regex processing, repeated conversion, or a large number of method calls.
For count_unique_with_list, the cost may be visible in the function itself rather than as a separate row for list membership. The important diagnosis is still meaningful:
The function spends substantial direct execution time repeatedly searching a growing list for each candidate word.
Do not optimize the first row mechanically. Ask:
- Is this a large fraction of the relevant end-to-end run?
- Does it occur in production, rather than only in setup or logging?
- Is the time actual computation, or waiting on I/O or intentional sleeping?
- What operation or data-structure choice causes the cost?
If the list-based function consumes 75 percent of a representative run, even an ideal optimization of everything else can improve total runtime by at most 25 percent. That is why finding the dominant cost matters more than making many tiny changes.
Memory profiling: allocations, retained objects, and peak usage
CPU and memory bottlenecks are independent. A program can be fast but exceed available RAM; it can also use little memory while being slow due to an inefficient algorithm.
For the text example, the materialized implementation creates overlapping objects:
full text string
    plus list of every matched word
        plus set of unique words
At its peak, all three may coexist. In contrast, the streaming-set version needs a set of unique words and only the current line’s temporary tokens.
A line-level report is particularly useful here because function-level timing cannot tell you which statement caused a large allocation.
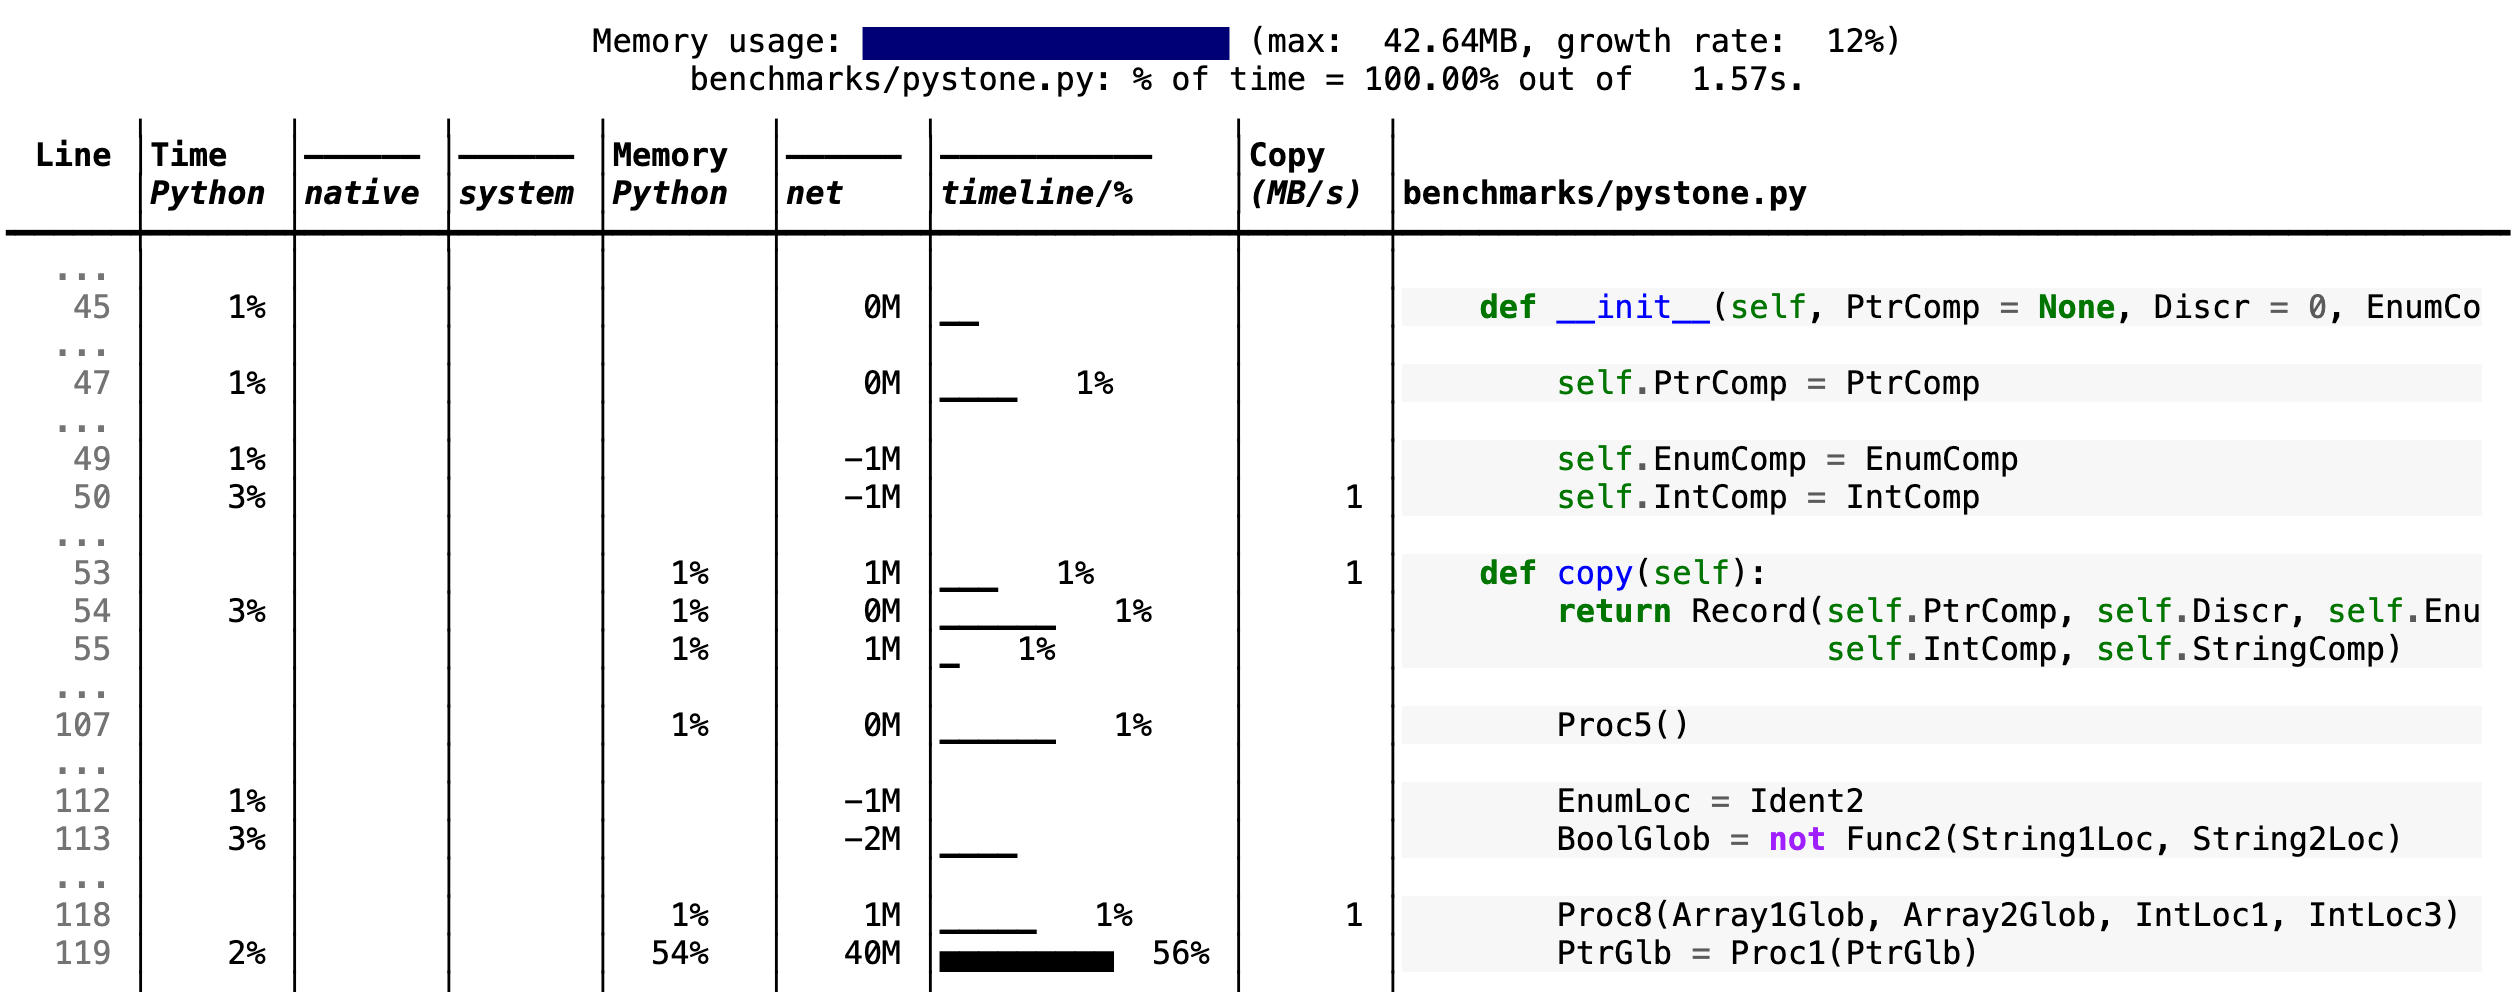
Scalene is useful for this kind of inspection because it combines CPU and memory information in a single line-oriented report. In your isolated environment, install it if needed and generate an HTML report:
python -m pip install scalene
python -m scalene --html --outfile artifacts/text_profile.html scripts/profile_text.py
Open artifacts/text_profile.html and inspect the three count_unique... functions. Your goal is not merely to find a large percentage. Identify:
- the line or function where allocations are concentrated;
- whether net memory increases substantially;
- whether the allocation occurs near the program’s peak;
- whether the objects are needed simultaneously.
Watch the focused line-level demonstration in NeuralNine’s “Memory Profiling in Python.” The package shown is a useful way to understand the report format, although Scalene is the better default for this course because it can report CPU and memory behavior together.
Watch line-level memory output. Focus on the distinction between a line’s memory increment and the total memory level after that line executes: an allocation is not automatically a leak, but it may still create an unacceptable peak.
What a memory result does and does not mean
A line that allocates 500 MB is not necessarily wrong. It may be necessary, short-lived work. It becomes a bottleneck when it causes an unacceptable peak, repeated allocation overhead, swapping, out-of-memory failures, or reduced ability to batch requests.
Likewise, a high memory level after a line does not prove that the line itself allocated all of it. It may simply be the point where earlier objects are still alive.
For count_unique_materialized, a strong diagnosis would be:
On the representative text workload,
count_unique_materializedis the dominant memory bottleneck. Reading the full file and materializing all token matches causes the source string, full token list, and unique-word set to coexist, producing the highest observed memory growth.
That is more useful than saying “the program uses lots of memory.” It names the workload, location, mechanism, and observed consequence.
A lightweight standard-library fallback
If you cannot use a line profiler, Python’s tracemalloc can still help locate Python-level allocation sites. It is a useful first check, though it does not represent all process memory and is not a substitute for GPU memory measurement in later PyTorch work.
from __future__ import annotations

import tracemalloc
from pathlib import Path


tracemalloc.start()

result = count_unique_materialized(
    Path("data/book.txt")
)

current_bytes, peak_bytes = tracemalloc.get_traced_memory()

print(f"Unique words: {result}")
print(f"Current traced memory: {current_bytes / 1_000_000:.1f} MB")
print(f"Peak traced memory: {peak_bytes / 1_000_000:.1f} MB")

snapshot = tracemalloc.take_snapshot()

for stat in snapshot.statistics("lineno")[:10]:
    print(stat)
Interpret the two memory values carefully:
- Current traced memory is what remains allocated at the measurement point.
- Peak traced memory is the highest traced allocation level since tracing began.
A function can have low current memory after returning but still have had a damaging peak while building an intermediate object. For the later VLM work, this distinction will matter when reasoning about activation memory, preprocessing batches, and key-value caches.
Turn profiler output into a defensible diagnosis
A profiler report is raw evidence. Your engineering result is a short, testable claim.
Use this template in a performance note or commit message:
Workload:
- Input: [fixed file, batch size, image resolution, request count]
- Environment: [Python version, package environment, machine]
- Measurement: [cProfile, Scalene, or another specified tool]

CPU finding:
- Dominant function or line:
- Evidence: [tottime, cumtime, call count, or percentage]
- Cause hypothesis:
- Expected safe change:

Memory finding:
- Dominant allocation or retained object:
- Evidence: [peak, net growth, allocation location]
- Cause hypothesis:
- Expected safe change:
For the text program, a completed CPU statement might be:
CPU finding:
- Dominant function: count_unique_with_list
- Evidence: it has the largest cumulative and direct execution-time share
  on the fixed book workload.
- Cause hypothesis: each candidate word performs membership testing in a
  growing list.
- Expected safe change: use a set for uniqueness testing while preserving
  the returned count.
And a memory statement:
Memory finding:
- Dominant function: count_unique_materialized
- Evidence: the report attributes the largest memory growth to full-file
  reading and token-list materialization.
- Cause hypothesis: full text, all tokens, and the unique-word set overlap.
- Expected safe change: stream lines and update a set incrementally.
The expected changes are intentionally modest. Avoid changing the algorithm, data layout, and concurrency model all at once. Make one change, rerun the existing tests, and rerun the same profile. Otherwise, you cannot tell which change produced the result or whether you preserved behavior.
Common profiling mistakes
- Profiling a toy input. A list lookup that is invisible at 100 words may dominate at 1 million words.
- Treating high
cumtimeas direct work. A coordinator function often has high cumulative time because its children do the actual work. - Ignoring call count. A tiny operation called millions of times can dominate a run.
- Optimizing waiting as though it were computation. Disk I/O, network waits, and deliberate sleeps need a different diagnosis.
- Confusing allocation with a leak. Temporary memory can be legitimate; peak and object lifetime determine whether it is a problem.
- Using profiler timings as a final benchmark. First locate the bottleneck; later benchmark alternative implementations under controlled conditions.
- Skipping correctness checks. Run the pytest suite after each optimization. A faster tokenizer or preprocessing function that changes outputs is not an improvement.
For the GPU-based stages later in the course, apply the same reasoning but use GPU-aware tools and measurements. A Python CPU profiler cannot by itself explain CUDA kernel time, device synchronization, or VRAM consumption.
Key takeaways and next step
- Performance optimization begins with a representative, controlled workload.
cProfileprovides function-level evidence: usecumtimeto find expensive pipeline stages andtottimeto find direct hotspots.- Call counts are diagnostic evidence, not just report noise.
- CPU and memory bottlenecks may be in different functions.
- A memory diagnosis should identify the allocation or retained objects responsible for peak usage, not merely report total RAM.
- Write a bottleneck statement that includes the workload, evidence, causal hypothesis, and one safe change to test.
- Preserve prior behavior with your pytest suite before and after every optimization.
You have now completed the production-grade Python foundations module. Next, the course moves from measurement to explanation: you will determine the asymptotic time and space complexity of data-processing routines, giving you a mathematical way to predict why the list-based approach becomes costly as input size grows.